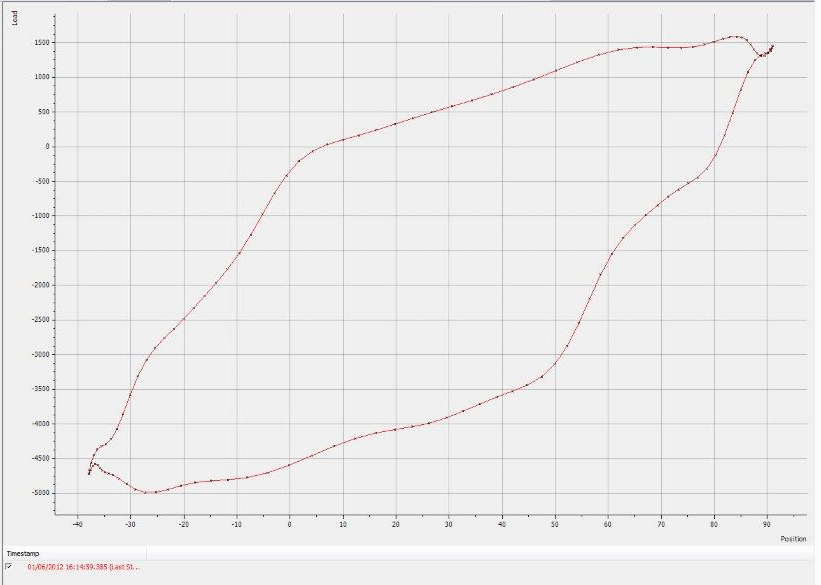
A Dynagraph can include the following elements:

- X-Axis—The horizontal axis that indicates the position of the pump in the well.
- Y-Axis—The vertical axis that indicates the loading on the pump.
- Key—The area at the bottom of the display that provides information about the data being shown (see Understand the Dynagraph's Key).
- Markers—Small symbols (the shape of a cross, diamond, or square) that can be shown on the Dynagraph. Each marker represents an individual data reading, indicating the rod pump loading at a particular position in the well.
- Traces—The lines that connect the markers together, to visually indicate the difference between the data readings.
- Title—The text than can be shown at the top of the Dynagraph, to provide users with information about the Dynagraph’s content.
Further Information