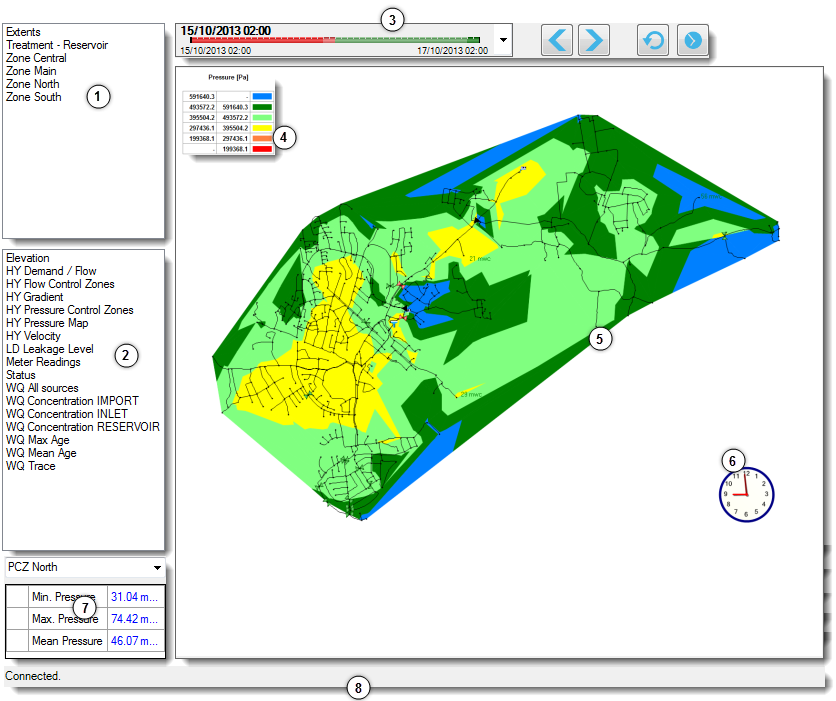
When the Aquis Thin Client Display Window is displayed it contains the following components:

NOTE: The toolbars may be hidden, see Working with Aquis Thin Client Toolbars
- View Bar— A view provides an easy way to change the currently presented view to a predefined geographical area. Views can for example focus on particular zones, model elements (such as a pump), or an arbitrary zoom state. The View Bar displays all the views that are defined within the Aquis application server, (see Working with Views) and Working with Aquis Thin Client Toolbars.
- Theme Bar— A theme is a snapshot of the current state of the network for the currently selected time. The Theme Bar displays all the themes that are defined within the Aquis application server. (see Working with Themes) and Working with Aquis Thin Client Toolbars.
- The Aquis Toolbar— This toolbar includes the following three tools, (see Using the Timeline):
- Timeline— This allows you to select a timeline provided by the Aquis application server. The currently selected time line determines the results that are shown in the display window for the currently selected theme. You can select any point in time along a selected time line or step through a selected time line using the Time step buttons. (see Using the Timeline).
NOTE: The time displayed in the Timeline depends on your regional settings (that is in local time) with a predefined time format.
- Time step buttons— The forward / backward arrows allow you to move through the selected timeline one step at a time, forwards or backwards. (see Using the Timeline).
- Refresh— This button allows you to manually update the data displayed within the selected themes, views, and time steps based on the current state of the Aquis application server. The currently selected time step will not change unless it no longer exists. The display can also be manually refreshed from the ViewX Edit menu (or F5 keyboard shortcut).
You can set the Aquis Thin Client to automatically refresh at certain intervals. (see Configuring the Aquis Server).
- Timeline— This allows you to select a timeline provided by the Aquis application server. The currently selected time line determines the results that are shown in the display window for the currently selected theme. You can select any point in time along a selected time line or step through a selected time line using the Time step buttons. (see Using the Timeline).
- Legend— A legend is displayed within a view for each theme that has been configured to show a legend. The legend changes to reflect the configuration of the objects and illustrates the theme boundaries in the model.
- Main view area— The results of the model are loaded from the Aquis Server and displayed in the main view for the currently selected theme at the currently selected time step.
Initially, the view is the default server view. You can change the view by selecting one of the options in the Views Bar.
Alternatively, you can zoom in on an object or area, see Using the Zoom Tool.
You can access object data, profiles and time series from within the main view using the right-hand mouse button. (see Accessing Object Data).
- Clock— When visible, the clock reflects the selected time of the view within the time line.
- KPI Table—The KPI table displays key performance indicators for the network as configured within the Aquis application server. These can show color and icon changes based on the configured criteria.
- Status bar— The status bar displays the status of the connection to the Aquis Server. When a connection has been established with the Aquis application server, it will display Connected. If the connection is lost or you encounter any connection issues the status bar displays the corresponding errors.