When you create a Trend, you need to associate it with at least one database item—the Trend can then plot the values (current or historic) of that item.
For the tutorial, you are going to plot the historic values of the 'AI 1' point. This point has been configured to have Historic data.
To plot the historic values of the 'AI 1' point:
- Display the Database Bar (see Display an Explorer Bar in the ClearSCADA Guide to ViewX and WebX Clients).
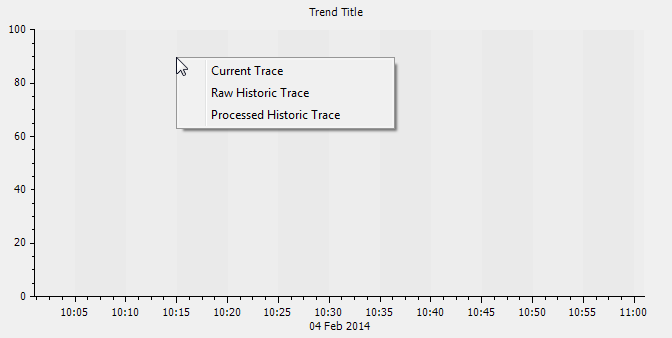
- In the Database Bar, select the 'AI 1' point. Keeping the left-hand mouse button pressed down, drag the 'AI 1' point onto the Trend editor.
A context sensitive menu is displayed. - Select the Raw Historic Trace option.

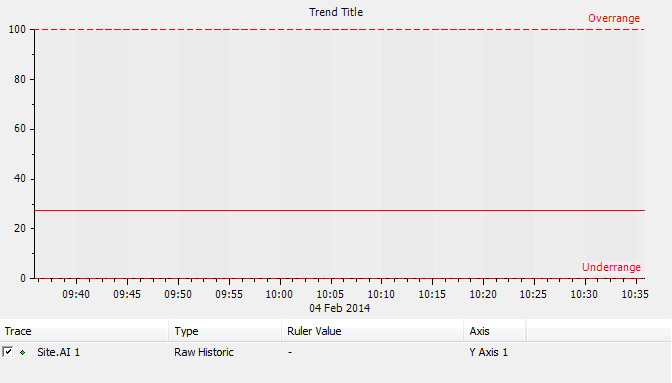
- This adds a trace to the Trend.

The trace is a line that represents the historic values that have been reported for the point (the Processed Historic Trace option adds a trace that represents historic values that have been calculated for the point).
NOTE: You can edit a trace so that it has a different style of appearance, including a Step and a Bar.
- On your plant simulator equipment, adjust the values of the first analog input so that the 'AI 1' point has a variety of values. If you are unable to access plant simulator equipment, you can simulate this effect by performing an override on the point:
- Right-click on the 'AI 1' point and select Properties to display its Form.
- On the Analog Point tab, scroll down to the Override section and select the Enabled check box to allow the point’s value to be manually overridden.
- Save the Form
- Right-click on the 'AI 1' point in the Database Bar and select its Override action.
This displays the Override window. - Enter a value of 90 then select OK to override the point’s value to 90.
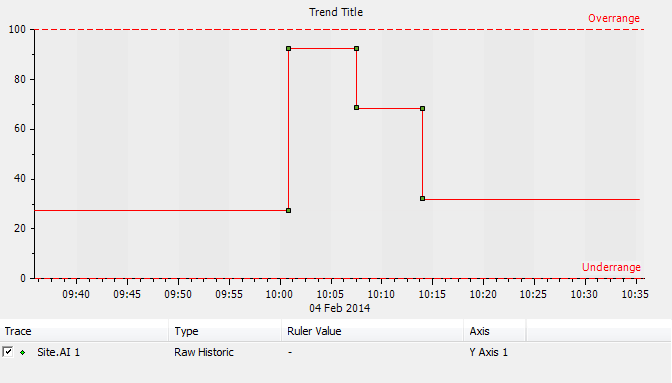
- Repeat this process, but override the point to have a value of 60 then 25 respectively. These override values will provide some historic data for the point as the point is configured to have Historic enabled.
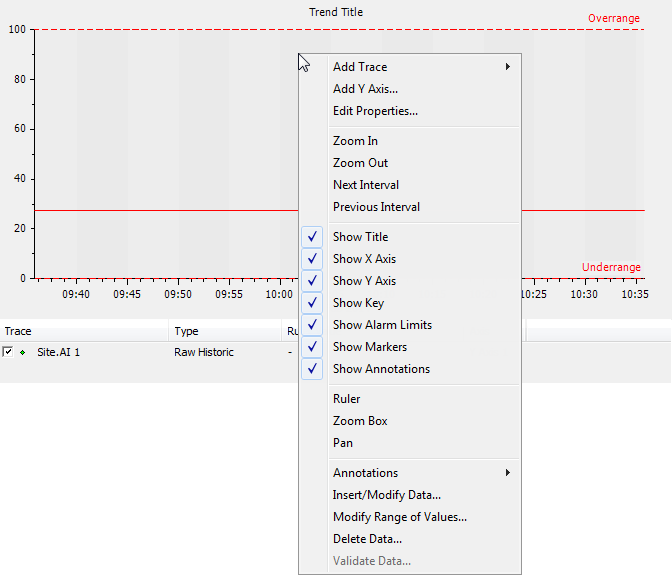
- Right-click on the background of the Trend to display a context sensitive menu.

- Select the Pan option. This enables Pan mode which you can use to drag the time line of the Trend (the time line is shown on the x-axis).
- Drag the trace that is shown on the Trend to view the plotted values for the point at various times.

The x-axis uses the default settings to determine the amount of time to show on a single interval. However, you can configure the x-axis to show different time scales (see Edit the X-Axis).
If you look at the y-axis, you will see that it is automatically configured to represent the entire range of values that have been configured for the 'AI 1' point (0 to 100). This is because the y-axis uses the default Mode of Range, which means it represents the configured range for the point.
If you plot the values of another point on the Trend, and the point’s possible values are incompatible with the range shown on the y-axis, ViewX will add a new y-axis. The new y-axis will have a range that is suitable for the possible values of the second point. If you continue to add additional traces, the same process will apply—if the y-axes on display have ranges that are incompatible with the points, new y-axes will be created. However, if the existing y-axes have appropriate ranges, the y-axes will be shared.
Now you have added the 'AI 1' point’s historic data to your Trend, you should proceed to Edit the X-Axis.
Further Information
Trends: see Understanding Trends in the ClearSCADA Guide to Trends.