Add the 'DI 1' Point’s Historic Values to a Trend
One of the major benefits of Trends is that they allow you to view and compare the values of multiple points simultaneously and in a graphical format.
On your Trend, you already have one trace that represents the 'AI 1' point, so now you are ready to add another trace. For the tutorial, you will add a trace for the 'DI 1' point:
- Display the Database Bar (see Display an Explorer Bar in the ClearSCADA Guide to ViewX and WebX Clients).
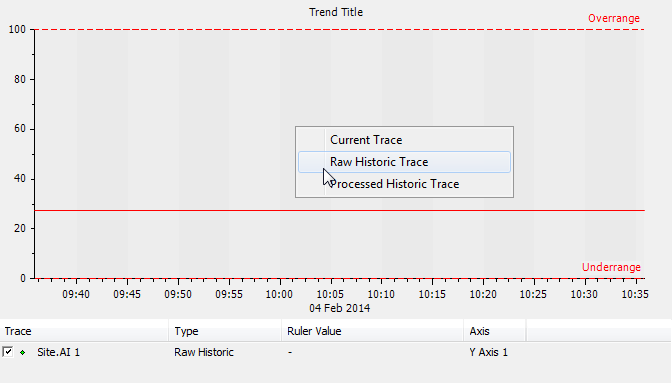
- In the Database Bar, select the 'DI 1' point. With the left-hand mouse button still pressed down, drag the point onto the Trend to display a context sensitive menu.

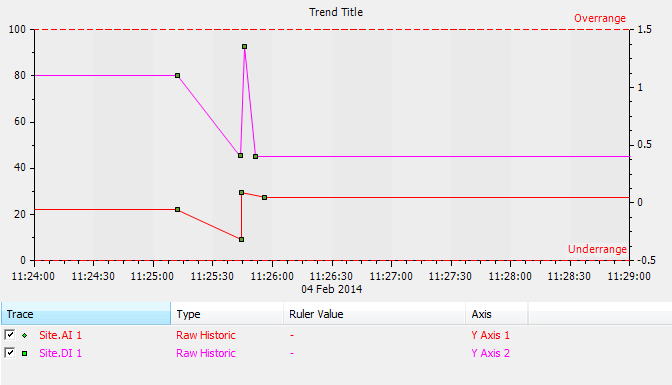
- Select the Raw Historic Trace option to add a trace to the Trend. The trace will plot the reported historic values for the 'DI 1' point.

An additional y-axis has been added, as the 'DI 1' point has a different range of possible values than the 'AI 1' point. The y-axis can be placed on the right or left of the trend display.
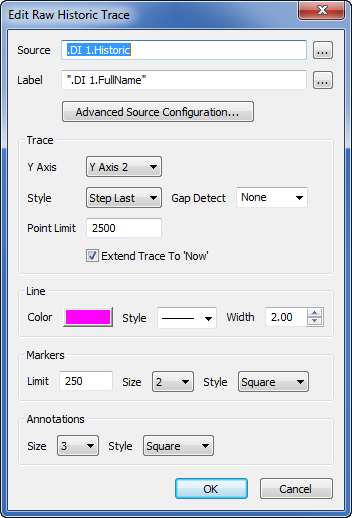
- Double-click on the 'Site.DI 1' trace in the key below the x-axis. This displays the Edit Raw Historic Trace window.

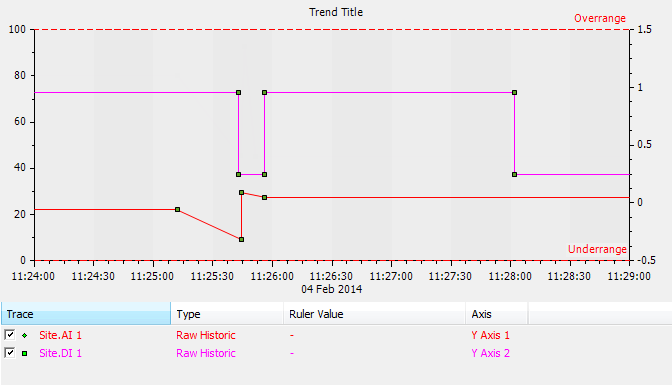
- In the Trace settings, set the Style to Step Last. This changes the type of trace line that is shown—instead of a straight, angled line between markers, the trace will be drawn so that there is a right-angle between markers. The horizontal part of the right-angle is drawn from the previous marker and the vertical part of the right-angle indicates the latest value.

- Save the Trend.
Further Information
Trace Configuration: see Configure a Trace in the ClearSCADA Guide to Trends.