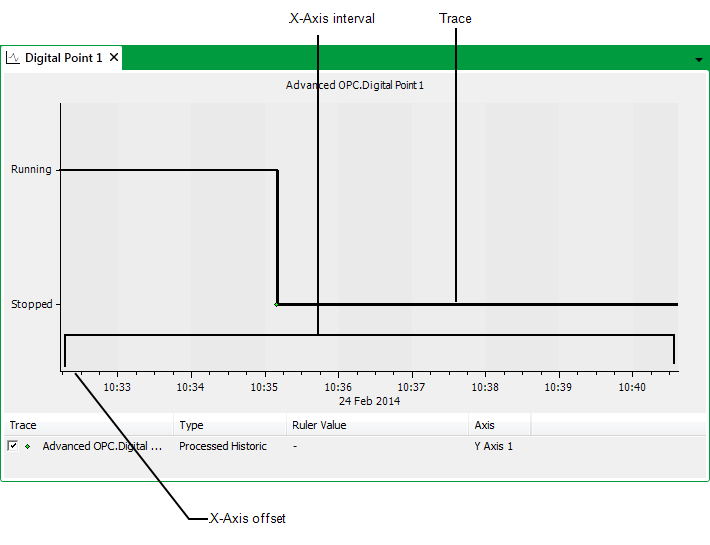
Each Trend consists of an x-axis, a y-axis, and a trace. The x-axis displays a time interval, and the y-axis displays the point states. The Trace represents the digital point’s current or historic state.
You need to define the values of the Trend’s x-axis, to determine the time period over which the point’s states are shown, so that a suitable range of units are displayed.
To do this for a Current Trend, you need to use the fields in the Trend section of the Digital Point Form’s Digital Point tab (see Procedure for Configuring the Settings for a Digital Point’s Current Trend).
For a Historic Trend, you need to use the fields on the Digital Point Form’s Historic tab (see Define the Time Period Shown on Historic Trends and Lists).