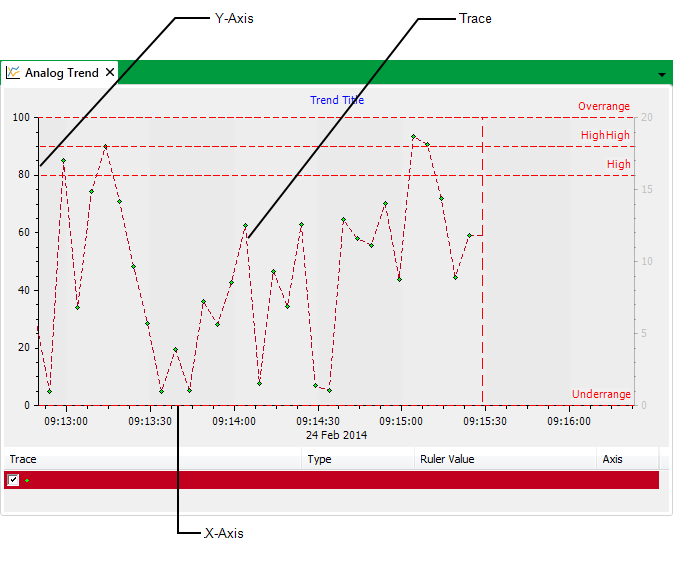
Each Trend consists of an x-axis, a y-axis, and a trace. The x-axis displays a time interval, and the y-axis displays the measurement units. The Trace represents the analog point’s current or historic values.
You need to define the values of the Trend’s y-axis, and determine whether it is logarithmic or linear so that a suitable range of units are shown. To do this, you need to use the fields in the Trend section of the Analog Point Form’s Analog Point tab (see Procedure for Configuring an Analog Point’s Trend Settings).
For Historic Trends, you also need to use the fields on the Analog Point Form’s Historic tab (see Define the Time Period Shown on Historic Trends and Lists).