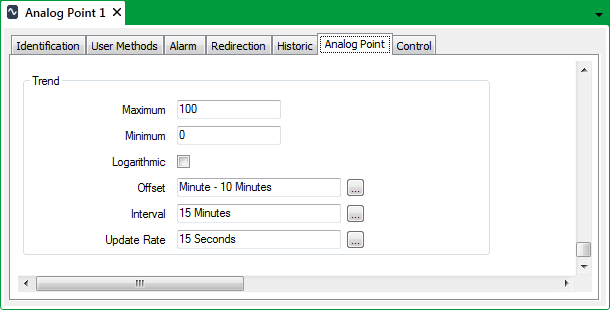
To configure an analog point’s Trend:
- Display the Form for the analog point that you want to configure (see Display a Form in the ClearSCADA Guide to Core Configuration).
- Select the Analog Point tab.
(If you are configuring this feature for another point that uses analog-type processing, select the appropriately named <Point Type> tab.) - Use the Trend section of the Form to define the range of the y-axis, and (for Current Trends only) the time interval of the x-axis:

- Enter the highest value to be shown on the y-axis in the Maximum field (within the Trend section).
- Enter the lowest value to be shown on the y-axis in the Minimum field (within the Trend section).
- Define whether the y-axis is logarithmic or linear:
- Select the Logarithmic check box if you want the y-axis to have a logarithmic scale.
- Clear the Logarithmic check box if you want the y-axis to have a linear scale.
- For Current Trends, follow the steps below to define the offset for, and the time interval of, the x-axis, along with the update rate for the Trend data.
For Historic Trends and Lists, define the time interval of the x-axis using the Trend/List fields on the Historic tab of the Point Form (see Define the Time Period Shown on Historic Trends and Lists).
NOTE: The following steps do not apply to Historic Trends.
- In the Offset field, specify the default start time for the x-axis, in relation to the present time, for whenever you view the data as a Current Trend.
Enter the required offset in the OPC Relative Time Format. You can enter the value directly in the field, or use the Offset window (accessed via the field's browse button) to specify the required value. For example, specify M - 10M for the earliest time on the x-axis to be ten minutes before the beginning of the current minute.
- In the Interval field, specify the default time interval for the x-axis, starting from the time specified in the Offset field, for whenever you view the data as a Current Trend.
Enter the required interval in the OPC Time Format. You can enter the value directly in the field, or use the Interval window (accessed via the field's browse button) to specify the required value. For example, specify 15M for the x-axis to display a 15-minute period.
- In the Update Rate field, specify the frequency with which the trace data on a Current Trend is updated.
Enter the required interval in the OPC Time Format. You can enter the value directly in the field, or use the Interval window (accessed via the field's browse button) to specify the required value. For example, specify 15S for the data to update at 15-second intervals.
- Save the configuration (see Saving Configuration Changes in the ClearSCADA Guide to Core Configuration).

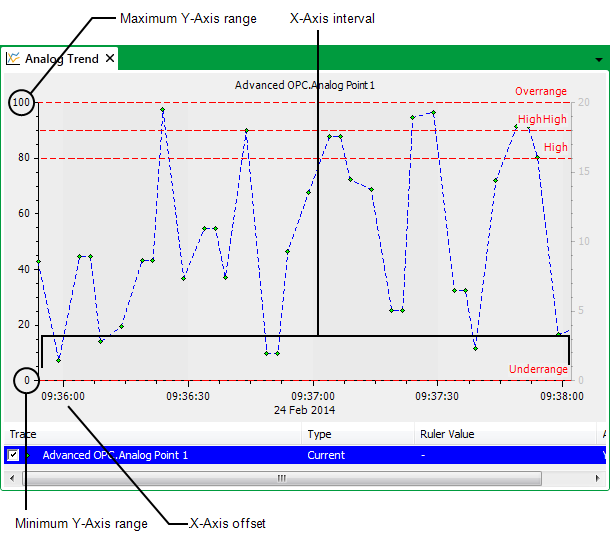
When a Current or Historic Trend is displayed for the point, the y-axis displays the range of values that remain within the Minimum value and Maximum value limits. It uses linear or logarithmic scaling in accordance with your selection for the Logarithmic check box.
When a Current Trend is displayed for the point, the Offset and Interval entries define the time period of the Trend, and the start time of the x-axis in relation to the present time.
Example:
The Interval of a Trend is set to 15M (15 minutes), and the Offset is M - 10M (10 minutes before the present minute). If the Trend is displayed and the present time is 12:00:05, the time period displayed by the x-axis would be 11:50:00 to 12:05:00, as the present time is rounded back to the beginning of the present minute.
Further Information
Overview of an Analog Point’s Trend.
For more information on Trends, see the ClearSCADA Guide to Trends.