You can use Data Grids to define the data that you want to include in a report.
A Data Grid effectively adds a ‘custom’ table to the ClearSCADA database (see Configuring Data Grids in the ClearSCADA Guide to Core Configuration).
If, for example, you want to collate together an arbitrary collection of values into tabular format and include those values in a single report, you may want to use a Data Grid to specify those values. Within the report, you then only need to specify the Data Grid table itself, rather than use Crystal Reports to constrain the data from other database table(s) to just those values that are of interest.
Similarly, if you want ClearSCADA to perform a series of calculations on some data and display the results of those calculations in a report, you may want to specify those calculations in a Data Grid, and attach that Data Grid to a report. A Data Grid can perform a variety of calculations, the results of which can be displayed in a report, so reducing the time that it takes to configure the report within the Crystal application.
For complex reports, you can attach more than one Data Grid to a report.
ATTENTION: We do not recommend renaming or removing fields from a Data Grid Table, after that Data Grid Table has been attached to a report. However, you can re-map the table data in the Crystal Reports application to reflect changes (see Map Field Changes to a Custom Table).
Example:
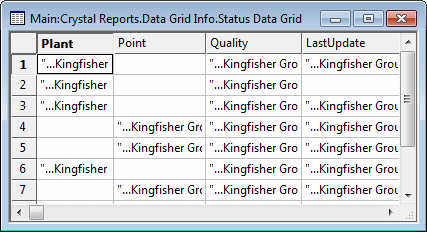
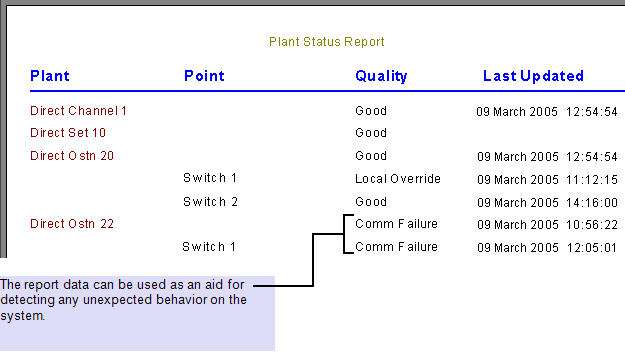
A Data Grid is produced that indicates the current quality of various items of plant—channels, sets, outstations, specific points, and so on. The entries in the Data Grid are grouped to reflect the system structure—for instance, the points in a particular outstation are listed below the outstation entry, and so on.

The information from the Data Grid is used in a report. The report is to be an aid for engineers that are troubleshooting on the system.
The Data Grid table is added to the report in the same way as other database tables.

The Data Grid fields, LastUpdate, Plant, Point, and Quality, are added to the report in the same way as other database fields.

The report is formatted as required.
The report configuration is saved. The report is generated and displayed to show the latest data.

NOTE: If you wanted to include the points on each of the outstations in the above report, rather than just a couple of specific points, it would be better to include the point data in a subreport (see Use a Subreport to Include Unrelated Data in the Same Report). (This would avoid the need to edit the Data Grid should any of the outstations’ points be added or removed from the database.)