If a DNP3 SCADAPack point has a current value and/or limit(s) that are profile-controlled and that profile data is stored historically, you can display the historic profile data in either of two ways:
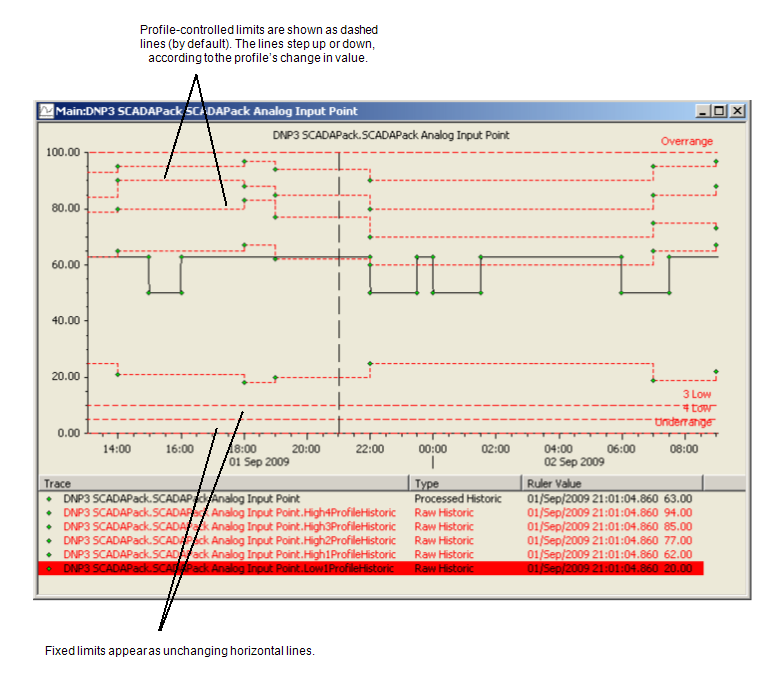
- In the form of a historic Trend, using the point’s Display Historic Trend pick action.
Example:
With this particular DNP3 SCADAPack analog point, the point’s four High limits and one of its Low limits are Profile-controlled. ClearSCADA is configured to store both the point’s and the DNP3 SCADAPack Profile’s data historically.
When the Display Historic Trend pick action is used to display the historic data in Trend format, the point’s data is displayed along with both its fixed and Profile-controlled limits.

- A ‘custom’ queries List can be configured and used to display historic profile data in List format.
Example:
This example uses the same DNP3 SCADAPack analog point as the example above.
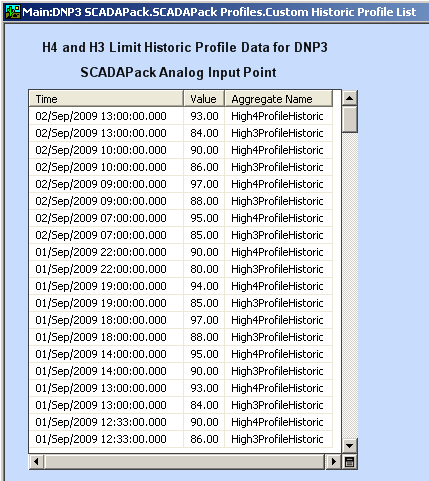
The historic data for the profiles that control the point’s 4 High and 3 High Limits is to be displayed in a ‘custom’ List. The List is embedded on a Mimic.
The List uses this SQL query:
- SELECT TOP( 100000 )
- "RecordId", "RecordTime" AS "~Time", "FormattedValue", "AggrName"
- FROM
- CDBPROFILEHISTORIC
- WHERE
- "Id" = 4204 AND ( "AggrName" = 'High4ProfileHistoric' OR "AggrName" = 'High3ProfileHistoric' ) AND "~Time" BETWEEN { OPC 'Month' } AND { OPC 'Now' }
- ORDER BY
- "~Time" DESC
CDBProfileHistoric is a pseudo historic table. It provides the interface to the historic aggregates that store the profile data.
The Id is that of the DNP3 SCADAPack analog point for which profile data is being displayed. (The Id can be ascertained by viewing the point’s Status display.)
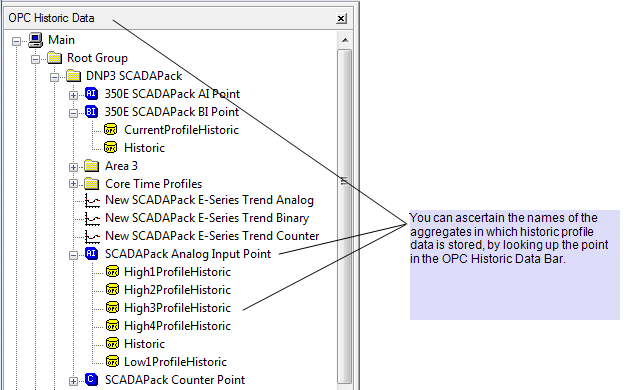
The historic data for each profile is stored in a separate aggregate. Each aggregate forms part of the CeNET table for the type of point that is being queried. For example, the CeNETAnalog table includes the historic aggregates for DNP3 SCADAPack Analog points, and the CeNETCounter table includes the historic aggregates for DNP3 SCADAPack Counter points. You can use the database Schema, the OPC Data Bar, or the OPC Historic Data Bar to ascertain the name of each aggregate.

(Unlike each point’s standard Historic aggregate, which appears as the Historic tab on each Point Form, historic profile aggregates do not appear on the Point Form, as they do not contain any configuration fields.)
In this particular example, only the historic data for the High4ProfileHistoric and High3ProfileHistoric aggregates is to be queried.
Each aggregate name corresponds to the current value or specific point Limit that is profile-controlled, regardless of the type of Profile (‘Daily’ or ‘Standard’) that is used to control that current value or Limit.
With a DNP3 SCADAPack point for which the current value is profile controlled, and for which ClearSCADA stores the profile data historically, you can query that data using the CurrentProfileHistoric aggregate. Additionally, with a DNP3 SCADAPack Analog point, up to eight ProfileHistoric aggregates can be queried, comprising four High and four Low ProfileHistoric aggregates. With a DNP3 SCADAPack Counter point, historically stored limit profile data is queried using the HighProfileHistoric aggregate.
RecordTime is used to constrain the List’s entries, so that the List only includes limit profile data from the start of the current month to ‘now’.
The SQL query results in the following type of information being displayed in List format:

- SELECT TOP( 100000 )
Further Information
Trends: see the ClearSCADA Guide to Trends.
Producing Custom Lists: see Custom Lists in the ClearSCADA Guide to Lists.
CDBProfileHistoric database table: see the database Schema.
Using the Database Schema: see Working with the Database Schema in the ClearSCADA Guide to the Database.