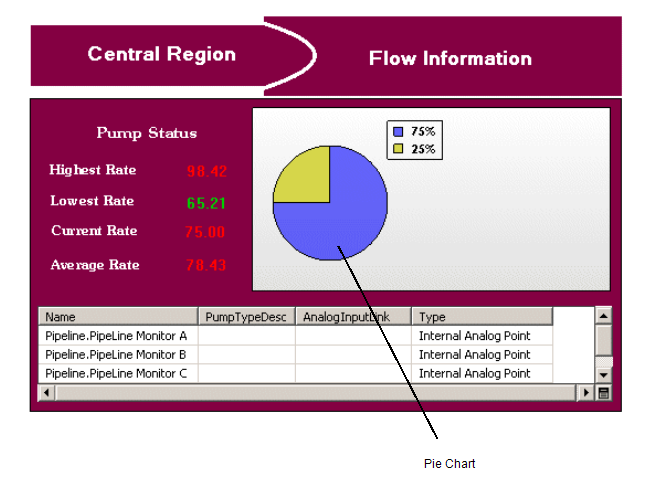
You can add pie charts to your Mimics. Pie charts are useful for displaying statistical information such as percentages.

To add a pie chart to a Mimic:
- Display a Mimic in Design mode.
- Select Chart in the Drawing command group on the Graphics Tab.

- Draw the outline of the pie chart by pressing the left-hand mouse button, and moving the cursor while keeping the left-hand mouse button pressed. The rectangle that is drawn is the space that will be occupied by the pie chart.
- Release the left-hand mouse button to add the pie chart. When you first add a pie chart, it is entirely black. This is because it is not associated with any values.
To associate the pie chart with values and define its settings, see Editing a Pie Chart.
When you have added the pie chart, you can re-position it by selecting it and dragging it to a new location.