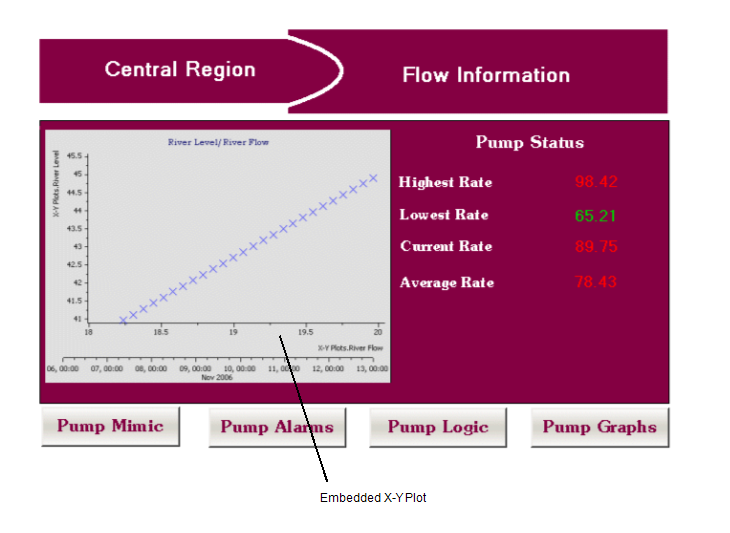
You can embed X-Y Plots on your Mimics. Embedded X-Y Plots update in the same way as X-Y Plots that are stored as database items and provide similar advantages to embedded Mimics:
- They allow you to display X-Y Plot data on a Mimic, which is especially useful on 'overview' Mimics.
- You can embed multiple X-Y Plots on a single Mimic. This is useful for comparing X-Y Plot data while also displaying other dynamic data such as states and values.

To embed an X-Y Plot on a Mimic:
- Display the Mimic that is to contain the embedded X-Y Plot. You need to display the Mimic in Design mode (see Displaying a Mimic).
- Select X-Y Plot in the Drawing command group on the Graphics Tab.

- Draw the outline of the embedded X-Y Plot by pressing the left-hand mouse button, and moving the cursor while keeping the left-hand mouse button pressed. The rectangle that is drawn is the space that will be occupied by the embedded X-Y Plot.
- Release the left-hand mouse button to display a browse window.
- Use the browse window to locate the X-Y Plot that you want to embed.
- Select the X-Y Plot that is to be embedded, then select the OK button to confirm.
The browse window is closed and the X-Y Plot is embedded.
Alternatively:
- Display the Database Bar (see Display an Explorer Bar in the ClearSCADA Guide to ViewX and WebX Clients).
- Display a Mimic in Design mode (see Displaying a Mimic).
- In the Database Bar, select the X-Y Plot that you want to embed and drag it onto the Mimic.
A context sensitive menu is displayed. - Select the Embedded X-Y Plot option to embed the X-Y Plot on the Mimic.
You can resize the embedded X-Y Plot by selecting it and dragging its sides. Similarly, you can reposition it by selecting it and dragging it to a new position.
You can edit the embedded X-Y Plot by double-clicking on it (see Editing an Embedded X-Y Plot). You can also access editing features by right-clicking on the embedded X-Y Plot to display a context sensitive menu (see Mimic Editing Features).