This example demonstrates how ClearSCADA might be configured to gather statistics from remote PCs. To access such data on remote machines, the Performance Monitor driver needs to log onto those machines using a suitable domain user account (see Configuring Performance Monitor Server Settings, and see Monitor Performance Data on Remote Nodes).
Example:
The Performance Monitor driver on a ClearSCADA system is used to monitor various statistics on the ClearSCADA client machines.
As the machines are in the same network domain as the server, a Domain account is created, which allows the ClearSCADA server to access each machine. (If the machines were in different domains, separate accounts would need creating for each domain. If suitable account(s) already exist on a system, these can be modified and used, instead of creating new accounts.)
On the ClearSCADA server(s), the security properties are configured to allow the Domain account user to ‘Log in as a Service’.
On each of the client (target) machines on which statistics are to be monitored, the security properties are configured to give the Domain account user access to the relevant performance data. (If the target machines were running a version of Windows® that has tightened security, the machines’ ‘Remote Registry’ would also need to be set to start up automatically (see Access Data on Machines Running a Version of Windows that has Tightened Security).)
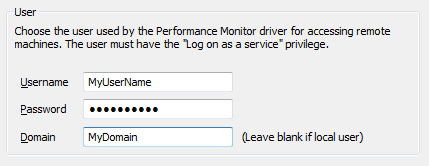
The ClearSCADA Server Configuration tool is run. The details of the above Domain account are specified on the Performance Monitor section of the tool:

The Performance Monitor driver is restarted.
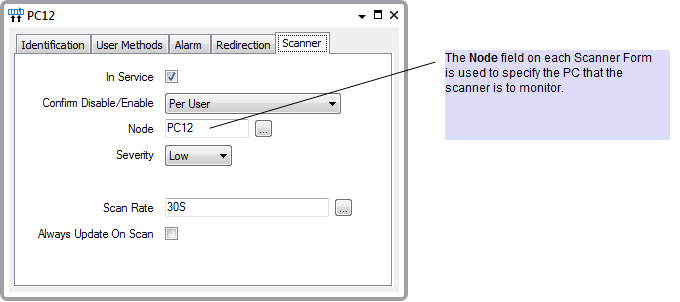
One Performance Monitor Scanner is added to the ClearSCADA database for each machine that the ClearSCADA server is to monitor. The Node field on each Performance Monitor Scanner Form is configured to reference the machine that each Scanner is to monitor.

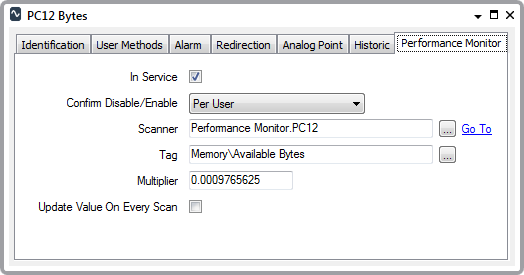
A set of Performance Monitor Analog points are added to the ClearSCADA database—one point per statistic that is to be monitored on a PC. The configuration of each point is suitably adjusted. In the figure below, for instance, an Analog point is used to monitor the available bytes on the machine PC12. The Multiplier is used to convert the bytes into kilobytes.

Operators are then able to view the statistics using, for example, a List:

Further Information
Configuring a Performance Monitor Scanner
Configuring Performance Monitor Points: see Configuring Analog Points
For information on using the Performance Monitor driver to monitor the available disk space on a ClearSCADA server, see Monitor the Available Disk Space in the ClearSCADA Guide to Server Administration.