Monitor the Available Disk Space
We recommend that you configure your ClearSCADA system to monitor the free disk space in each of the servers. This will allow ClearSCADA to generate alarms if there is a low amount of disk space available.
If there is insufficient disk space available to store the database files, the server will enter Error Mode (the server icon will change color to magenta). When in Error mode, the server will continue to attempt to save the database files and historic data, and if disk space has become available, will be able to recover without loss of data. However, there is a risk that if the server unexpectedly shuts down while during Error mode, data could be lost. Similarly, data could be lost if both the disk space and memory become full, as the server may stop running.
For this reason, we strongly recommend that you create and configure Performance Monitor points to monitor the available disk space on each drive in each server. The alarm limits for the points should be set up to relate to a low amount of available disk space.
To use Performance Monitor points, the Performance Monitor Driver has to be installed and running on the ClearSCADA servers on your system (see the ClearSCADA Guide to Drivers).
To set up a Performance Monitor point to monitor the amount of free disk space on a selected drive:
- Run ViewX on the server and Log on.
- Display the Database Bar (see Display an Explorer Bar in the ClearSCADA Guide to ViewX and WebX Clients).
- Right-click on the Group or System that will contain the Performance Monitor point that monitors the free disk space.
A context-sensitive menu is displayed. - Select the Create New option, and then the Performance Monitor option, and then the Scanner option.
A new Performance Monitor scanner is added to the database. It is selected automatically, ready for you to define its name. - Enter a suitable name for the Performance Monitor scanner (such as the name of one of the servers), and press the Enter key or select another part of the interface to confirm the name.
- Right-click on the Group or System that you selected in step 3.
A context-sensitive menu is displayed. - Select the Create Newoption, and then the Performance Monitor option, and then the Analog Point option.
A new Performance Monitor analog point is added to the database. It is selected automatically, ready for you to define its name. - Enter a suitable name for the Performance Monitor analog point (such as the 'name' of one of the disks, for example, 'C Drive Free Space'), and press the Enter key or select another past of the interface to confirm the name.
- Right-click on the new Performance Monitor scanner.
A context-sensitive menu is displayed. - Select the Edit Properties option.
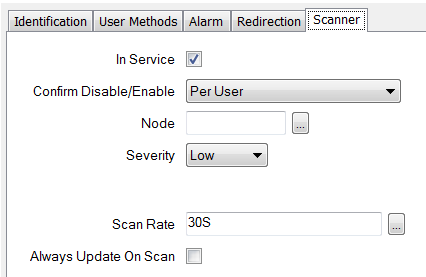
The Performance Monitor Scanner Form is displayed.
- Select the In Service check box so that the Performance Monitor scanner is active
- Use the Confirm Disable/Enable field to specify whether a confirmation dialog box is displayed whenever a user requests that the scanner is disabled (taken Out of Service) or enabled (placed In Service).
- In the Node field, enter the node name of the server that you want to monitor the available disk space.
- Use the Severity combo box to define the importance of alarms relating to the scanner's status. We recommend that you set the Severity to a high level of importance. For more information on the severity levels, see Alarm and Event Severities.
- Use the Area of Interest field (if available) to associate the scanner with a specific Area of Interest. For more information, see Restrict Alarm and Event Access to Specific Areas of Interest in the ClearSCADA Guide to Core Configuration.
- Use the Scan Rate field to define how often the disk space will be checked. We suggest that you define a scan rate time of 10 or 15 minutes. Enter the required interval in the OPC Time Format. You can enter the value directly in the field, or use the Interval window (accessed via the field's browse button) to specify the required value.
- Use the Always Update on Scan check box to define whether the points that are going to be associated with the scanner are updated each time there is a scan.
If the contents of the disk you are monitoring change frequently, we recommend that you clear the Always Update on Scan check box as the point will be updated automatically.
If the contents of the disk you are monitoring rarely change, we advise that you select the Always Update on Scan check box so that the point is updated on a regular basis.
- Save the configuration (see Saving Configuration Changes in the ClearSCADA Guide to Core Configuration).
- In the Database Bar, right-click on the Performance Monitor analog point that you added in step 7.
A context-sensitive menu is displayed. - Select the Edit Properties option.
The Performance Monitor Analog Point Form is displayed. - Select the Analog Point tab.
- Define the alarm limits. You should set the Full Scale, High-High, and High limits to 100 (for 100% disk space available), and use the Low and Low Low to define the settings that determine when an alarm is raised. We suggest that the first alarm is set to be raised when 10% disk space is available, and a higher priority alarm when 5% disk space is available.
For example:
- Full Scale—100
- High High—100
- High—100
- Low—10
- Low Low—5
- Zero Scale—0
- Use the Descriptions combo boxes to set appropriate descriptions for each alarm condition.
- Use the Severity combo boxes to define the importance of each alarm limit. We suggest that you use high importance alarms for the Low and Low Low limits.
- Enter % in the Units field (the units are percentages of the total amount of disk space).
- Select the Historic tab.
- Select the Enabled check box. This activates historic storage so that you can display the disk usage on Trends.
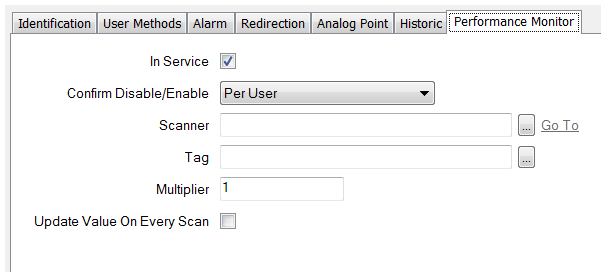
- Select the Performance Monitor tab.

- Select the In Service check box to so that the point is active.
- Use the Confirm Disable/Enable combo box to specify whether a confirmation dialog box is displayed whenever a user requests that this point is disabled or enabled. For more information on this setting, see Requesting Confirmation of Action Requests in the ClearSCADA Guide to Core Configuration.
- Use the browse button for the Scanner field to locate and select the Performance Monitor scanner that you created in step 5.
- Select the browse button next to the Tag field.
A Reference window is displayed. - Expand the LogicalDisk branch of the tree-structure.
- Expand the % Free Space branch.
- Select the branch that relates to the drive you want the point to represent, for example, C: for the C: drive.
- Select the OK button.
The Reference window is closed. - Leave the Multiplier field set to 1 as scaling is not required.
- Use the Update Value on Every Scan check box to specify whether the scanner is to update the value of this point within ClearSCADA every time the point' s source is scanned, regardless of whether the value has changed.
Select the check box if the value of the point is to be updated whenever its source is scanned. For example, you should select the Update Value on Every Scan check box if the point' s value is to trigger Logic program(s) whenever a scan occurs. Another common reason for selecting the Update Value on Every Scan check box is to allow ClearSCADA to use a recently retrieved value for a point that rarely has value changes.
Clear the Update Value on Every Scan check box if the value of the point is only to be updated within ClearSCADA if its value has changed from the last recorded value. The Update Value on Every Scan setting is often disabled when a point is associated with a value that often changes (as the frequent changes mean the point’s value is updated regularly, without the need for an update on every scan).
- Save the configuration (see Saving Configuration Changes in the ClearSCADA Guide to Core Configuration).
- Repeat the steps that relate to Performance Monitor point configuration for each drive that is to be scanned.
The point(s) values represent the percentage of available disk space on the relevant drives. - Repeat the entire procedure for each server.
Further Information
For further information about configuring Performance Monitor scanners and analog points, see the ClearSCADA Guide to the Performance Monitor Driver.