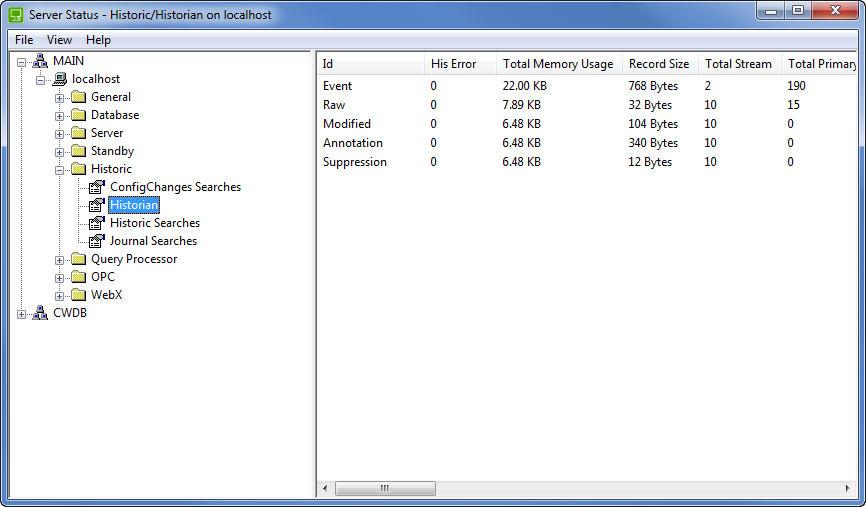
You can use the Diagnostics category and the Historian category to check the number of events that have been generated by the server. An excessive number of events can cause high load on a server.
The Diagnostics category provides status information about the OPC events which include system events and alarm related activities such as alarms being acknowledged or cleared.
The Historian category provides status information about the ClearSCADA events—these are the historic events that are stored on the hard disk and are shown on the Events List.
If you are experiencing slow performance of the Events List, you should first determine whether:
- An appropriate cache size is in place
- The Stream Size setting for Events is suitable
- Your server has appropriate hardware for your requirements
For information on these settings and requirements, see Slow Events List Performance due to the Event Journal Cache becoming Full.
If the cache size, stream size, and server hardware are sufficient, you should investigate the number of event records being generated:
- Run the Server Status Tool.
- Expand the system, then the Database folder, then select the Diagnostics category.
- Examine the number of Events that have been processed.
If there are tens or hundreds of events being generated per second, there is a high load on the server. Typically, excessive numbers of events being generated is caused by inappropriate configuration. Proceed to step 6.
If the number of events is increasing at less than ten per second, the high load on the server is not being caused by an excessive number of OPC events. Proceed to step 4.
- Expand the Historic folder, then select the Historian category.

- Examine the Total Record entry for the Event data. This indicates the number of historic events that have been generated and stored on the hard disk.
If the number of historic events increases by tens or hundreds per second, there may be too many events being generated. Proceed to step 6.
If the number of historic events is not increasing, or is increasing at a rate slower than ten events per second, the number of historic events being generated is unlikely to affect the server load. Please refer back to Diagnose and Resolve the Server Load Problems.
- Run ViewX and log on.
- Display the Events List. You should filter it so that it shows the events that were generated during the time that the clients were experiencing slow performance. For further details, see Events Lists in the ClearSCADA Guide to Lists.
- Look at the Source entries to identify the database items for which excessive numbers of events have been generated.
- Look at the Message entries for the database items you identified as having excessive numbers of events. The Message describes the event that has been generated (which you can use to determine the cause of the event).
- Use the Source and Message information in conjunction with your knowledge of the system specification and configuration to determine whether you can alter the configuration to reduce the load. For example, you may be able to alter the configuration of a point so that there are fewer events generated for it.
Excessive numbers of events are often caused by automatic activities, such as:
- Changes at plant being reported by the outstations, PLCs etc.
- Scheduled activities
- Logic programs being executed too frequently.
If altering the configuration would affect your system so that it would no longer meet your requirements, you may need to upgrade the server hardware. Please contact Schneider Electric for more advice.