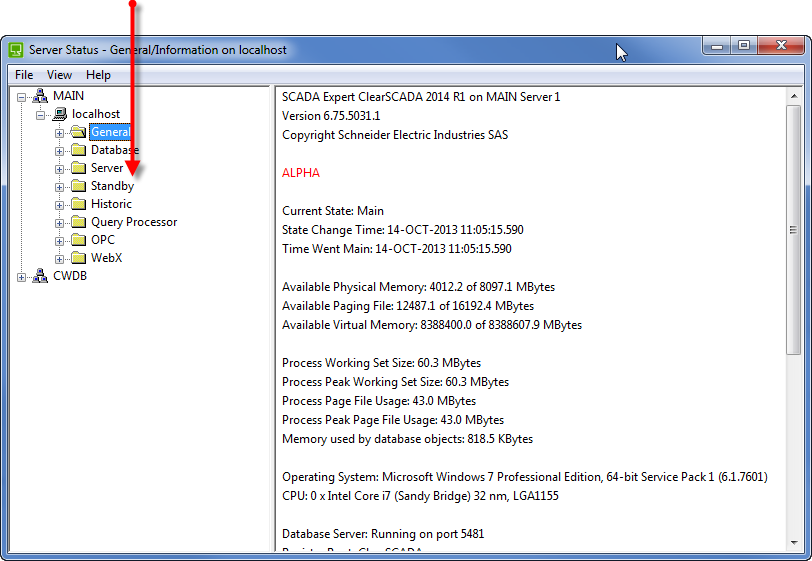
The Server Status Explorer provides a tree-structure that groups the status information. The Server Status Explorer is shown on the left-hand side of the Server Status Tool window (the right-hand side of the window is called the Server Status Display, and is used to display the various status settings).
Server Status Explorer

Each system is represented in the Server Status Explorer and can be expanded to reveal groups. Each group represents a specific type of information and contains categories of data.
You can use the + and - symbols to expand/collapse the hierarchy of systems, groups and categories as required. To display the data for a category, simply select the required category—the data is shown in the Server Status Display.