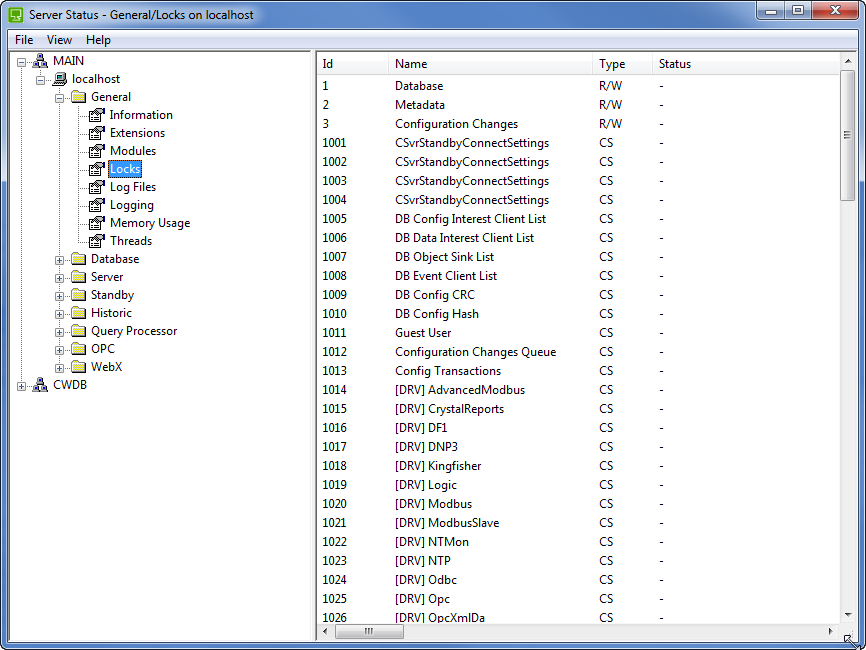
To help you monitor your system and investigate unexpected system behavior, ClearSCADA includes a Server Status Tool. Available on your ClearSCADA servers, the Server Status Tool provides detailed statistical and diagnostic information.

Using the information shown in the Server Status Tool, you can:
- Monitor the current status of your system
- Investigate any unexpected performance issues
- Identify the cause of unexpected system behavior (you may also be able to resolve your issues completely by changing configuration settings or altering external factors that are affecting ClearSCADA)
- Enable and disable logging for the various ClearSCADA components. If your system experiences issues that require expert analysis from Schneider Electric engineers, you may be asked to provide log files. The log files contain detailed information about your system’s activity.
In this section, we provide an Overview of the Server Status Tool and explain how to:
- Run the Server Status Tool
- Save a SnapShot of the Status Data Currently on Display
- Define when the Server Status Tool is Updated
- Get Support for a Specific Driver
- Access Documentation for a Specific Driver
- Find Updates for a Specific Driver.
When working with the Server Status Tool, you will also need to be familiar with the Server Status Categories.
NOTE: You can also use the OPC Data Bar to view status values, see Working with the OPC Data Bar in the ClearSCADA Guide to Core Configuration.