The Average Interpolated algorithm calculates an average value based on:
- The interpolated value for the start of the resample interval.
- The good quality raw historic values in the resample interval.
For this calculation, ClearSCADA adds up the values listed above and then divides total by the number of values. The result is the average interpolated value and it has a timestamp that matches the start time of the sample.
For example, lets say a trace is configured to use the Average Interpolated algorithm and is set to have a resample interval of 10M (10 minutes). This means that for each 10 minute sample, ClearSCADA will calculate an interpolated average. ClearSCADA achieves this by:
-
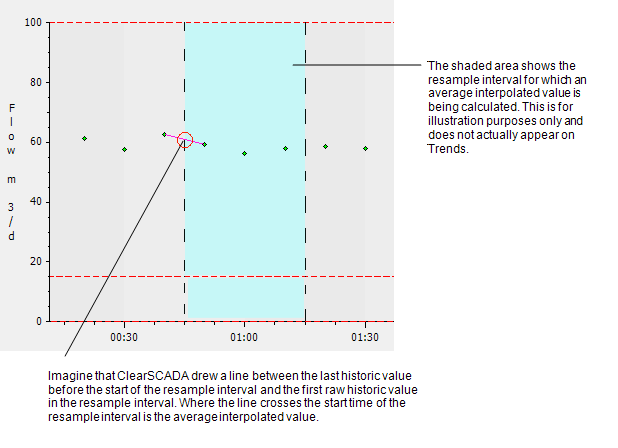
Estimating an interpolated value for the start of the resample interval. To do this, it performs a calculation that uses the last raw historic value before the start of the sample and also the first raw historic value in the sample. Internally, ClearSCADA calculates what value it would need to plot at the start of the resample interval if it were to draw a line between the last raw historic value before the sample and the first raw historic value in the sample.

- ClearSCADA then calculates the average value for the sample. It adds up the interpolated value from step 1 and each of the raw historic values in the sample. It then divides the result by the number of values, so if there were 7 raw historic values in the sample, the total would be divided by 8 (as the interpolated value is also included).
The result of steps 1 and 2 is the average interpolated value for the sample and it is plotted at the start of the resample interval.
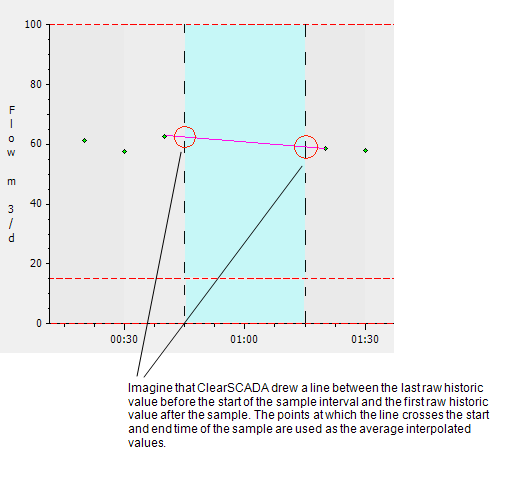
The average interpolated algorithm is useful when you want to calculate the average values for data that has gaps (periods of no values). This is because the average interpolated algorithm uses raw values outside of the sample in its calculation, which means it can still return a value even if the sample contains no values. For example, if the sample contains no values, ClearSCADA will use the last raw value before the sample and the first raw value after the sample to create two estimated values. These values match the values that would be plotted on the start time and end time of the sample were ClearSCADA to draw a line between the last raw historic value before the sample and the first raw historic value after the sample.

The 2 values that are calculated are then added together and divided by 2 to provide the average interpolated value for the resample interval. This value has a timestamp that matches the start of the resample interval.
If there are no values in the sample and there are no values after the sample, the interpolated value will be the same as the last value before the sample. As a result, the average interpolated value will also be the same as the last value before the sample, as there is only a single value to use in the calculation.
NOTE: If there is a raw historic value with a timestamp that matches the start of the sample exactly, and there are no values in the sample or after the sample, the raw historic value is used as the average interpolated value.
Further Information