When you first configure a Trend, the X-Axis uses the default settings for your system. If the default settings are inappropriate for your requirements, you can alter the settings for the X-Axis. For example, you may need to alter the amount of time that is represented on the X-Axis by changing the Interval setting.
To configure the X-Axis:
- Display the Trend that has the X-Axis that you want to change (see Display a Trend in Design Mode).
- Right-click on the X-Axis.
A context-sensitive menu is displayed. -
Select the Edit...option.
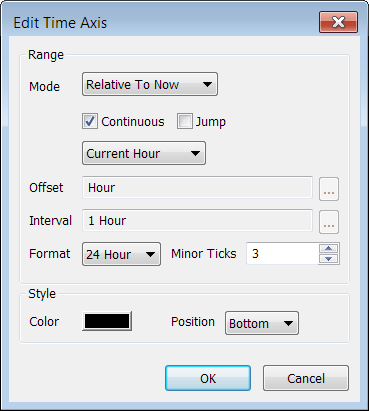
The Edit X-Axis window is displayed.
- Select the mode for the X-Axis from the Mode combo box. The mode defines the type of time scale shown on the X-Axis and can be:
- Absolute—The Trend displays the data for a specific time. You can use the navigation tools to view the values for different times, but the Trend will revert to the specified time when it is re-displayed. You can define the specific time by using the Start and End settings.
- Relative to Now—The Trend displays the data for a time that is relative to the present time, for example, the data for yesterday.
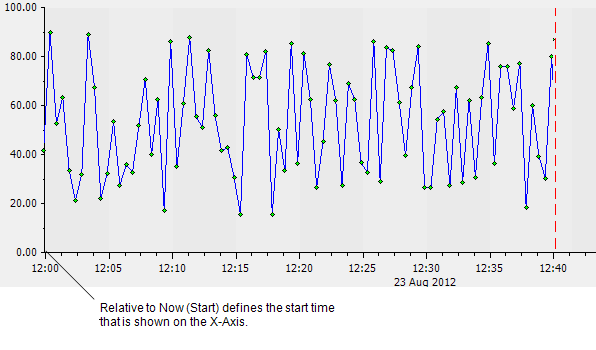
For example, if the current time is 12.40,Relative to Now is selected, and the Interval is set to -4OM, the first time on the X-Axis will be 12.00 (NOW-40 minutes).

- Relative to Latest—The Trend displays the data for a time that is relative to the latest value to be plotted on the Trend.
-
Use the Continuous and Jump check boxes to define how you want the relative X-Axis to scroll or update.
- Select the Continuous check box to continuously scroll the X-Axis when the time almost reaches the end of the time interval currently shown on the X-axis. This is continuous mode. In this mode, you can automatically follow the trend’s trace after it reaches the end of the current X-Axis time interval. ClearSCADA will continue to scroll the X-Axis even if you zoom or pan in any direction.
- Clear the Continuous check box if you do not want the X-Axis to scroll when the time reaches the end of the time interval currently shown on the X-Axis. This is non-continuous mode.
- Select the Jump check box if you want the X-axis to show (jump to) the time interval after the time interval currently shown on the X-Axis. It will do this when the time reaches the end of the current X-Axis time interval. This is Jump mode. ClearSCADA will only display the Jump check box if you first select the Continuous check box. If a user manually zooms, scrolls or pans a trend, ClearSCADA will disable Jump mode.
Examples:Continuous Mode
You select the Continuous check box. The Offset is H and the Interval is 1H, so the Trend displays the trace for a one-hour period from the start of the current hour.
You display the trend at 10:30, so the X-Axis shows the time interval from 10:00 to 11:00.
The time almost reaches 11:00. The X-Axis starts to scroll so that it continuously shows data for the previous hour. For example, when the time reaches 11.05, the X-Axis will show a time interval from 10:05 to 11:05. Therefore, after 11.00, you will see data for the previous hour.
Non-Continuous Mode
You clear the Continuous check box. The Offset is H and the Interval is 1H, so the Trend displays the trace for a one-hour period from the start of the current hour.
You display the trend at 10:30, and so the X-Axis shows the time interval from 10:00 to 11:00.
The time reaches 11:00. The X-Axis does not update or scroll. It continues to show a time interval of 10:00 to 11:00. Therefore, after 11.00 you will only see data for the period 10.00 to 11.00.
Jump Mode
You select the Continuous and Jump check boxes. The Offset is H and the Interval is 1H, so the Trend displays the trace for a one-hour period from the start of the current hour.
You display the trend at 10:30, so the X-Axis shows the time interval from 10:00 to 11:00.
The time reaches 11:00. ClearSCADA updates the X-Axis so that it shows the next time interval. That is, from 11:00 to 12:00. Therefore, after 11.00, you will see data for the period 11.00 to 12.00.
- Use the combo box below the Continuous check box to define a preset time scale or a custom time scale for the X-Axis (this only applies when the Mode is set to Relative to Now or Relative to Latest).
Choose from:
- Current Minute—Sets the axis to represent 1 minute, beginning at the start of the current minute. (The Offset and Interval are configured automatically and are grayed out).
- Previous Minute—Sets the axis to represent 1 minute, beginning at the start of the previous minute. (The Offset and Interval are configured automatically and are grayed out).
- Current Hour—Sets the axis to represent 1 hour, beginning at the start of the current hour. (The Offset and Interval are configured automatically and are grayed out).
- Previous Hour—Sets the axis to represent 1 hour, beginning at the start of the previous hour (The Offset and Interval are configured automatically and are grayed out).
- Today—Sets the axis to represent 1 day, beginning at the start of the current day. (The Offset and Interval are configured automatically and are grayed out).
- Yesterday—Sets the axis to represent 1 day, beginning at the start of the previous day. (The Offset and Interval are configured automatically and are grayed out).
- This Week—Sets the axis to represent 1 week, beginning at the start of the current week. (The Offset and Interval are configured automatically and are grayed out).
- Last Week—Sets the axis to represent 1 week, beginning at the start of the previous week. (The Offset and Interval are configured automatically and are grayed out).
- This Month—Sets the axis to represent 1 month, beginning at the start of the current month. (The Offset and Interval are configured automatically and are grayed out).
- Last Month—Sets the axis to represent 1 month, beginning at the start of the previous month. (The Offset and Interval are configured automatically and are grayed out).
- This Year—Sets the axis to represent 1 year, beginning at the start of the current year. (The Offset and Interval are configured automatically and are grayed out).
- Last Year—Sets the axis to represent 1 year, beginning at the start of the previous year. (The Offset and Interval are configured automatically and are grayed out).
- Other—Allows you to define the time span shown on the axis. When you select the Other option, the Offset and Interval fields become available. Use the Offset and Interval fields to define the time scale shown on the axis.
If you have set the time scale for the X-Axis to any of the predefined time scales (that is, selected any option except Other) proceed to step 8.
If you have set the time scale for the X-Axis to Other, proceed to step 7.
- Use the Offset and Interval fields to define the time shown on the X-Axis:
- Offset—Defines the start time or end time of the X-Axis. For example if the Offset is H then the start time for the X-Axis is the beginning of the current hour.
- Interval—The amount of time that is displayed on the X-Axis at one time. For example, if the Interval is 12 hours, the X-Axis displays a 12 hour period.
When entering the times for the Offset and Interval, you need to use the appropriate OPC Time formats (see Using OPC Time Formats in the ClearSCADA Guide to Core Configuration).
You can skip from one period to another by using the Previous Interval and Next Interval navigation tools (see View Earlier or Later Values on a Trend).
NOTE: New Trends have a custom time scale with an Offset of H (hour), and an Interval of 1H (1 hour), by default. This means that the X-Axis displays from the start of the current hour up to the end of the current hour.
- Use the Format combo box to select the time format for the X-Axis. You can choose to display the time in the 24 Hour format, or the 12 Hour format. By default, a Trend uses the 24 hour format.
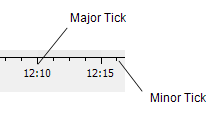
- Use the Minor Ticks spin box to define the number of small indicators that are shown on the X-Axis. The minor ticks are positioned between the larger indicators, referred to as major ticks.

You can define how many minor ticks are shown between each pair of major ticks.
- Use the Color button to define the color for the X-Axis. You can select a color from the color palette or select the ... option to display the Color window. You can use the Color window to create a custom color as required (see The Color Palette Window in the ClearSCADA Guide to Core Configuration).
- Use the Position combo box to define the position of the X-Axis on the Trend. You can chose to display the axis at the Top or the Bottom of the Trend.
- Select the OK button to confirm your selections and close the Edit X-Axis window.
Your Trend will use the settings you have selected.NOTE: The amount of data that is shown on your Trend is dependent on the amount of time that has elapsed since you inserted the trace. As time passes, more data will be shown on your Trend.
- Select the Save button to store the changes to the Trend.