The Count algorithm calculates the total number of good quality raw historic values in the resample interval. The result of the calculation has a timestamp that matches the start time of the sample.
Example:
A Trend can be configured to show the raw historic values of a point for the period 14:00 to 15:00. The point is updated every second, and so has 60 raw historic values per minute.
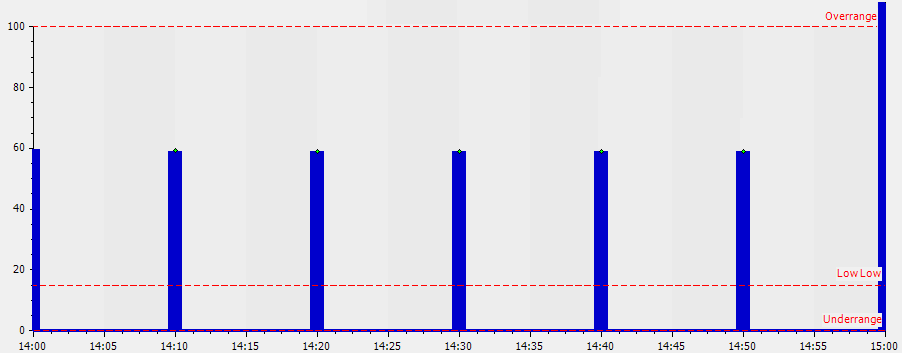
The raw historic value trace is hidden using the Show>None option for the trace, and then a new trace for the point is created. The new trace is a processed historic trace that is configured to use the Count algorithm and has an Interval setting of 10M (10 minutes). The trace is configured to use the Filled Bar style and a Bar Width of 1M (each bar is the same width as 1 minute of time on the X-Axis). The Trend shows:

By viewing the processed historic trace, a user can see that the point had regular amounts of historic data values for each sample until the 15:00 sample. Between 15:00 and 15:10 (which would be the next bar on the Trend), the count value increased to Overrange. This means that, at that time, the point had been reconfigured to be scanned more frequently than once per second (or had developed a fault).
Further Information