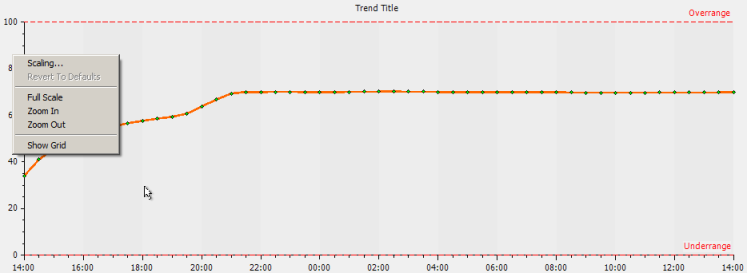
You can display grid lines on the X-Axis or the Y-Axes. The grid lines are a visual indicator that can make it easier to determine the values—you can use the grid lines to line up the values on the trace with the values and times shown on the axes.
The grid feature is especially useful when you are trying to determine the value of parts of a trace that are not positioned near to an axis.
To hide and show the grid lines:
-
Right-click on the Y-Axis.
A context sensitive menu is displayed.
-
Enable the Show Grid option.
The horizontal grid lines are displayed.
- Repeat step 1 to re-display the context sensitive menu for the Y-Axis.
- Disable the Show Grid option.
The horizontal grid lines are hidden. - You can show and hide the X-Axis grid lines using the same method, except that you have to right-click on the X-Axis.