The Max algorithm calculates the highest good quality raw historic value in the resample interval. The result of the calculation (the highest value in the resample interval) has a timestamp that matches the start time of the sample.
Example:
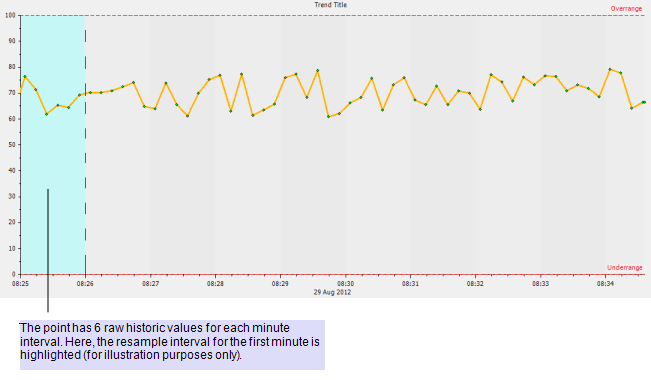
For example, let’s say a Trend is configured to show the raw historic values of a point for the period 08:25 to 08:35. The point is updated every 10 seconds, so there are 6 raw historic values per minute. During the first minute, the point’s raw historic values are 76.4, 71.41, 61.93, 65.93, 65.36, 64.5, and 69.3.

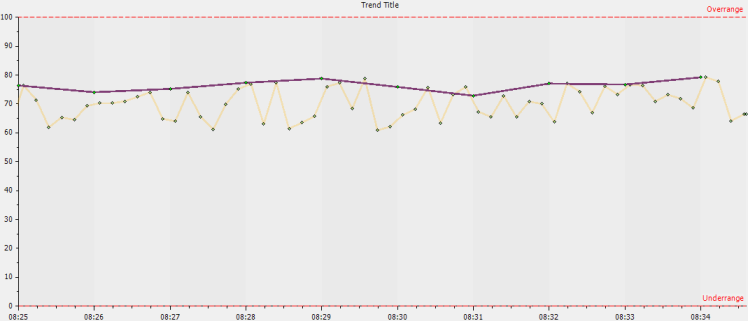
By configuring a processed historic trace for the same point, and setting that trace to use a Max algorithm with a 1M (1 minute) resample interval, a user can view the maximum values for the point. A maximum value is calculated for each minute on the Trend (as defined by the resample interval of the trace).

The processed historic trace using the Max algorithm shows 10 values for the period 08:25 to 08:35, with each value matching the highest raw historic value in each minute interval. For example, in the minute 08:25 to 08:26, the highest raw value is 76.4 and so the calculated max value for the same period is 76.4.