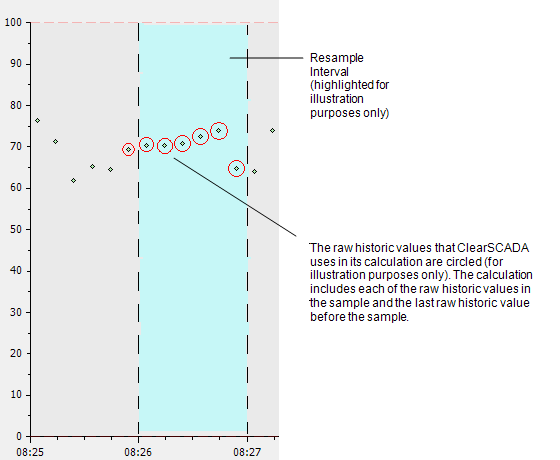
The Max Last algorithm calculates a maximum value based on:
- The last raw historic value before the start of the resample interval
- The raw historic values in the resample interval.
To calculate the Max Last value, ClearSCADA:
- Examines the raw historic values in the sample and the last raw historic value before the sample.
- Returns the highest value of those values examined in Step 1. This is the Max Last result and it has a timestamp that matches the start time of the sample.
The results returned do not depend on the quality of the data. You can choose to filter the data on quality using the Qualities combo box in the Edit Source window ((see Configure a Trace)).
Like the Max Interpolated algorithm, the Max Last algorithm is useful when there are gaps in the data - it allows a maximum value to be calculated for time periods where there are no, or no good quality, raw historic values. However, the Max Last algorithm only uses actual raw historic values, unlike the Max Interpolated algorithm which uses an estimated historic value (the interpolated value).

Example:
A trace is configured to use the Max Last algorithm and is set to have a resample interval of 1M (1 minute). This means that for each 1 minute sample, ClearSCADA will calculate a maximum last value.
At 10:31, ClearSCADA has to plot an maximum last value on the trace. To do this, it compares the last raw historic value from before 10:31 to each of the values in the sample (10:31 - 10:32). In this case, the values are:
- Value before sample: 33.4
- Sample values: 29.11, 27.48, 30.32. 30.34, 34.12, 30.43.
This means the max last value is 34.12 (the highest value). This value is plotted on the trace at 10:31.