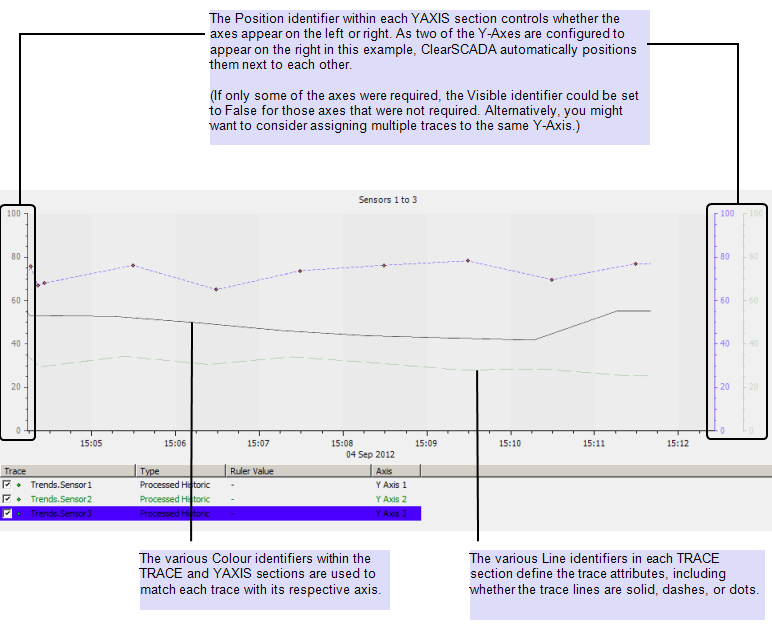
This example demonstrates how TrendSpec might be used to define a Trend that contains three traces. As with single-trace ad hoc Trends, each TRACE section in the TrendSpec definition for a multi-trace Trend has to have a corresponding YAXIS section, regardless of whether each Y-Axis is actually displayed on the Trend.
Example:
TrendSpec is used to define an ad hoc Trend that includes three traces. The definition for the Trend is used in a script subroutine, to enable the Trend to be accessed via a button on a Mimic. When selected, the button is configured to run the script and display the Trend. The ClearSCADA script hyperlink function App.OpenWindow sets the Trend to appear in a separate window to the Mimic from which it is accessed.
- sub ThreeSensors
- dim S
- S = "SCX:////Trend/"
- S = S & "TREND("
- S = S & "TRACE(PROCESSEDHISTORIC, 'Y Axis 1' ,"
- S = S & "Label = 'AdHocTrends.Sensor1',"
- S = S & "SOURCE('AdHocTrends.Sensor1.Historic'),"
- S = S & "TraceStyle = TRACELINE, RawOverlay = False,"
- S = S & "LineColour = RGB(0,0,0),"
- S = S & "LineStyle = DASHSOLID, LineWidth = 0.000000),"
- S = S & "TRACE(PROCESSEDHISTORIC, 'Y Axis 2' ,"
- S = S & "Label = 'AdHocTrends.Sensor2',"
- S = S & "SOURCE('AdHocTrends.Sensor2.Historic'),"
- S = S & "TraceStyle = TRACELINE, RawOverlay = False,"
- S = S & "LineColour = RGB(0,128,0),"
- S = S & "LineStyle = DASHDASH, LineWidth = 0.250000),"
- S = S & "TRACE(PROCESSEDHISTORIC, 'Y Axis 3' ,"
- S = S & "Label = 'AdHocTrends.Sensor3',"
- S = S & "SOURCE('AdHocTrends.Sensor3.Historic'),"
- S = S & "TraceStyle = TRACELINE, RawOverlay = True,"
- S = S & "LineColour = RGB(75,0,255),"
- S = S & "LineStyle = DASHDOT, LineWidth = 0.500000),"
- S = S & "XAXIS(RELATIVELATEST, Interval = '6H'),"
- S = S & "YAXIS('Y Axis 1' , Position = LEFT,"
- S = S & "Visible = True, Colour = RGB(0,0,0)),"
- S = S & "YAXIS('Y Axis 2' , Position = RIGHT,"
- S = S & "Visible = True, Colour = RGB(0,128,0)),"
- S = S & "YAXIS('Y Axis 3' , Position = RIGHT,"
- S = S & "Visible = True, Colour = RGB(75,0,255)),"
- S = S & "Title = 'Sensors 1 to 3')"
- App.OpenWindow( S )
- End Sub
The TrendSpec definition sets this particular ad hoc Trend to display traces of processed historic data from each data source. The RawOverlay identifier in each TRACE section determines whether the raw historic data values are also displayed on the Trend. (The RawOverlay identifier only applies when a TRACE’s <Data Mode> is set to PROCESSEDHISTORIC.)
Various other identifiers in the TrendSpec definition further control the Trend’s appearance:

Further Information
For detailed information on scripting, see the ClearSCADA Guide to Scripting.
For information on using a hyperlink to display an ad hoc Trend, see Creating a Hyperlink to a Trend or X-Y Plot in the ClearSCADA Guide to Mimics.