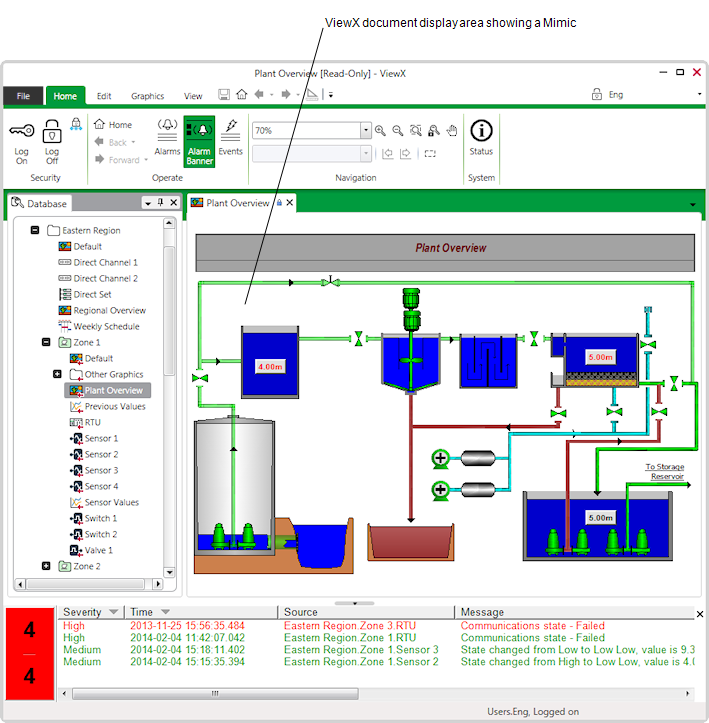
The ViewX document display area is the main part of the ViewX interface and is where the ViewX displays are shown. These include:
- Mimics—Graphical displays that usually show dynamic representations of plant and provide access to the actions and controls that you will need to perform your tasks (see Mimics).
- Trends—Displays that plot the values of points on a Trend with an x-axis and at least one y-axis. These displays are used to compare values over periods of time and to determine patterns in the data, for example determine at what times a point’s value is high (see Trends).
- Lists—Lists that you can use to display specific items and their various property values. The Lists provide access to the actions and controls that you will need to perform your tasks, and also allow you to compare various different values (see Lists).
Typically, you will perform many of your tasks from Mimics, Trends, and Lists that are shown in the ViewX document display area.

You can change the size of the ViewX document display area by selecting the left-hand side or bottom boundary and dragging it. This either increases or decreases the height or width of the ViewX document display area—the Explorer Bar and Alarm Banner are resized accordingly. (Your user account permissions may not allow resizing of the Alarm Banner.)