You can use the Trend Properties window to change the appearance of an X-Y Plot. You can change the:
- Title—You can change the text of the X-Y Plot title and alter its color
- Fonts—You can change the style and size of the fonts used on the X-Y Plot
- Background Color—You can change the background color of the X-Y Plot.
The ability to change the appearance of an X-Y Plot is useful for:
- Presenting detailed X-Y Plot data more clearly
- Giving descriptive titles to your X-Y Plots
- Maintaining consistent color schemes throughout your system.
To alter the appearance of the X-Y Plot:
- Display the X-Y Plot in Design mode (see Display an X-Y Plot in Design Mode).
- Right-click just to the right of the Y-Axis or just above the X-Axis.
A context-sensitive menu is displayed. - Select the Edit Properties option.
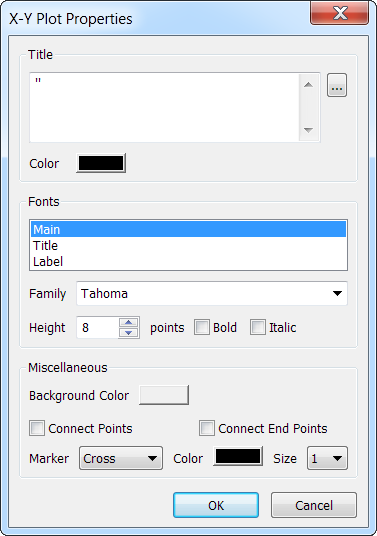
The X-Y Plot Properties window is displayed.
- Edit the Title as required:
- In the Title field, alter the title by editing the text manually, or by using the browse button to select a tag from the database. Even if you enter a Title manually, you have to enclose the title with single quotation marks as it is a tag.
- Use the Color button to define the color of the Title text. As with other color buttons, you can select a color from the palette or select the ... color option and then use the Color window to create a custom color. For more information, see Using the Color Window to Define a Color in the ClearSCADA Guide to Core Configuration.
- Edit the Main Font as required (the Main Font is used on the Time Line and both axes):
- Font—Select the style of lettering from the list of available fonts.
- Height—Use the spin-box to increase or decrease the size of the lettering as required.
- Bold—Select the Bold check box to embolden the Main Font text, or clear the check box to use normal text. Emboldened text appears as darker and thicker text and is often used for emphasis.
- Italic—Select the Italic check box to italicize the Main Font text, or clear the check box to use normal text. Italicized text appears as leaning text and is often used for emphasis.
- Edit the Title Font as required (the Title Font is only used for the Title text). The Font, Height, Bold, and Italic settings work in the same way as the Main Font settings.
- Edit the Label Font as required (the Label Font is only used for the text that is shown on the axes). The Font, Height, Bold, and Italic settings work in the same way as the Main Font settings.
- Use the Background color button to change the color of the X-Y Plot background as required. As with other color buttons, you can select a color from the palette or select the ... color option and then use the Color window to create a custom color.
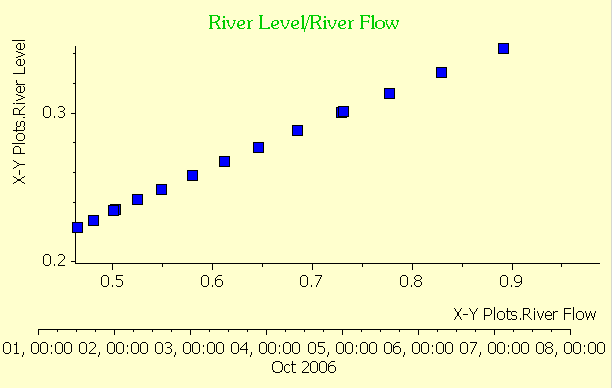
Example:
An X-Y Plot with the background color set to a custom color (pale yellow) instead of the default gray.

For more information, see Using the Color Window to Define a Color in the ClearSCADA Guide to Core Configuration.
- Use the Connect Points check box to define whether a line is drawn between each marker. This setting is cleared by default, which means that there is no line between the markers. If you select the check box, ClearSCADA will draw a line between the markers, for example, a line will be drawn from the first marker to the second marker, the second marker to the third marker and so on.
- Use the Connect End Points check box to define whether a line is drawn between the first marker and the last marker. This can be useful when you want a clear, visual indication of the difference between the first value and the last value (but are not especially interested in the values inbetween).
By default, the Connect End Points setting is cleared, so ClearSCADA does not draw a line between the first and last values. You can set ClearSCADA to draw the line by selecting the check box.
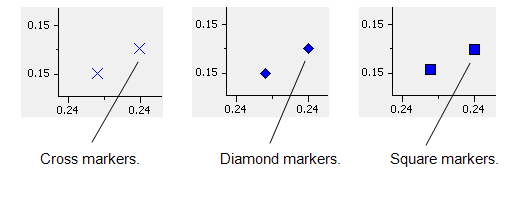
- Use the Marker combo-box to specify the shape of the markers used on the X-Y Plot (Cross, Diamond or Square).

- Use the Marker Color button to choose the color of the markers on the X-Y Plot. This works in the same way as the Background Color button (see step 7), but only applies to the markers.
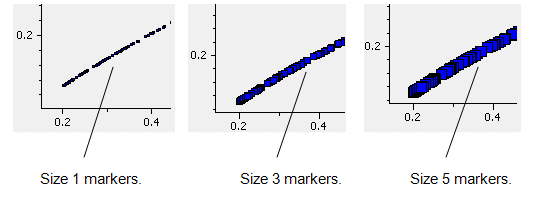
- Choose an appropriate Size for the markers. You can choose a size from 1 to 5, where size 1 is the smallest and size 5 is the largest. You should choose the size that is suitable for the X-Y Plot. For example, smaller marker sizes are recommended for traces that contain a high number of markers, as large markers can make traces appear cluttered, especially when there are a high number of values on display.
