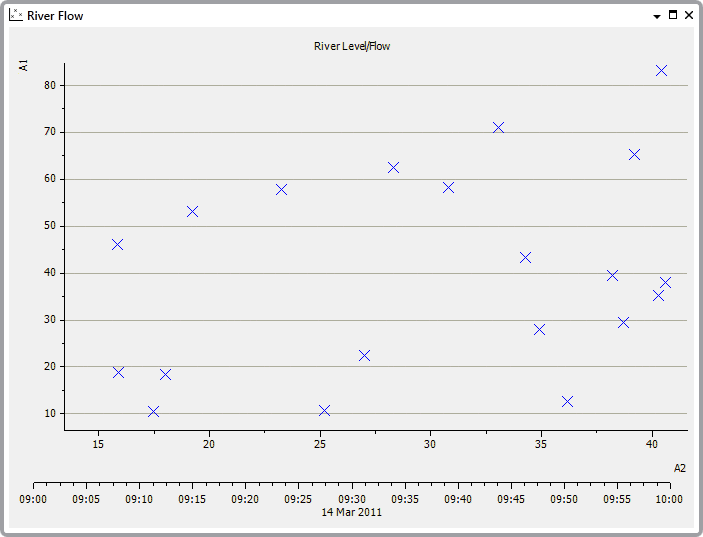
X-Y Plots, like Mimics and Trends, have two modes:
- Design mode—Used by engineers to configure the X-Y Plot.
- Run mode—Used by operators to view the data provided on the X-Y Plot.
In this section, we are going to explain how to access an X-Y Plot in Run mode. When you have displayed an X-Y Plot in Run mode, you can use it to examine the relationship between the values provided by the two data sources.
To display an X-Y Plot in Run mode:
- Log on to ViewX via a User account that has the Operate feature enabled (on the User Form) and has the Read and Browse permissions for the X-Y Plot item (or its parent Group).
- Display the Database Bar (see Display an Explorer Bar in the ClearSCADA Guide to ViewX and WebX Clients).
- In the Database Bar, locate the X-Y Plot item and then right-click on it.
A context sensitive menu is displayed. - Select the Display X-Y Plotoption.
The X-Y Plot is displayed in Run mode.
Alternatively, you can display the X-Y Plot in Run mode by performing one of the following:
- Double-click on the X-Y Plot in the Database Bar (if your User Account does not have the Double Click Edits Documents feature enabled).
Or:
- Display the X-Y Plot on, or from, a suitably configured Mimic.
Or:
- Right-click on the X-Y Plot in a Queries List.
- Select the Display option.
Or:
- Display the X-Y Plot in Design mode (see Display an X-Y Plot in Design Mode).
- Perform one of the following:
- Deselect the Design Mode button
 on the Quick Access Toolbar.
Or:
- Deselect the Design Mode command
 on the ViewX ribbon's Edit tab.
- Deselect the Design Mode button
When you have displayed an X-Y Plot in Run mode, you can proceed to learn about the navigation tools. See: