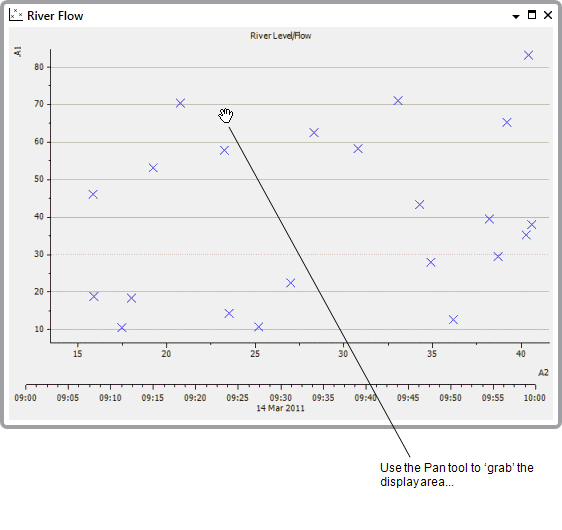
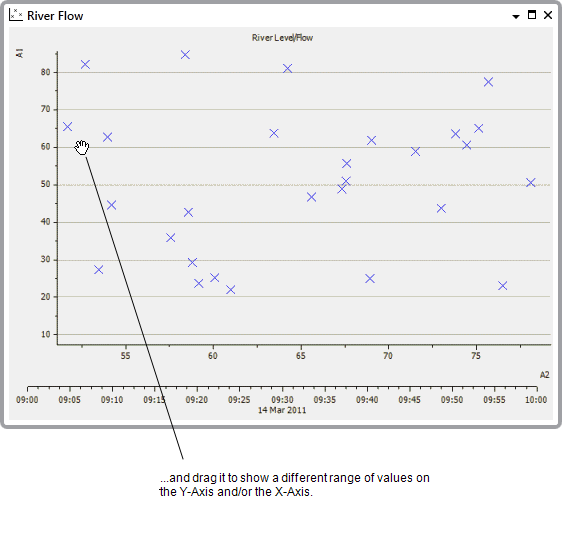
You can use the Pan tool to ‘drag’ the Y-Axis or X-Axis on an X-Y Plot so that other values in the axes’ range are displayed. For example, if the Y-Axis shows values 1 to 10 on a single display, you can use the Pan tool to drag the Y-Axis so that it shows other values, such as -10 to 0, or 20 to 30 as required.
To use the Pan tool to display a different range of values on the Y-Axis or X-Axis:
- Display an X-Y Plot in Run Mode.
NOTE: The Pan tool is also available when you are configuring the X-Y Plot in Design mode.
- Activate the Pan tool by performing one of the following:
- Select the Home tab on the ViewX ribbon.
- Select the Pan Mode command from the relevant command group.
or:
- Position the cursor on the Y-Axis, X-Axis, or the display area.
- Press the mouse wheel button and keep it held down.
When the Pan tool is activated, the cursor changes to resemble a hand.

- Pan the X-Y Plot as follows:
- If you have not used the mouse wheel button to activate the Pan tool, press the left-hand mouse button and keep it held down. With the mouse button depressed, move the cursor left or right or up or down to drag the axes to show different values. Release the button to stop panning.


- If you have used the mouse wheel button to activate the Pan tool, keep the mouse wheel button pressed down and move the cursor left or right or up or down to drag the axes to show different values.
- If you have not used the mouse wheel button to activate the Pan tool, press the left-hand mouse button and keep it held down. With the mouse button depressed, move the cursor left or right or up or down to drag the axes to show different values. Release the button to stop panning.
- When you have finished navigating the X-Y Plot, deactivate the Pan tool by performing one of the following:
- Select the Home tab on the ViewX ribbon.
- Deselect the Pan command from the relevant command group.
or:
- Release the mouse wheel button (this only applies if you have used the mouse wheel button to activate the Pan tool).