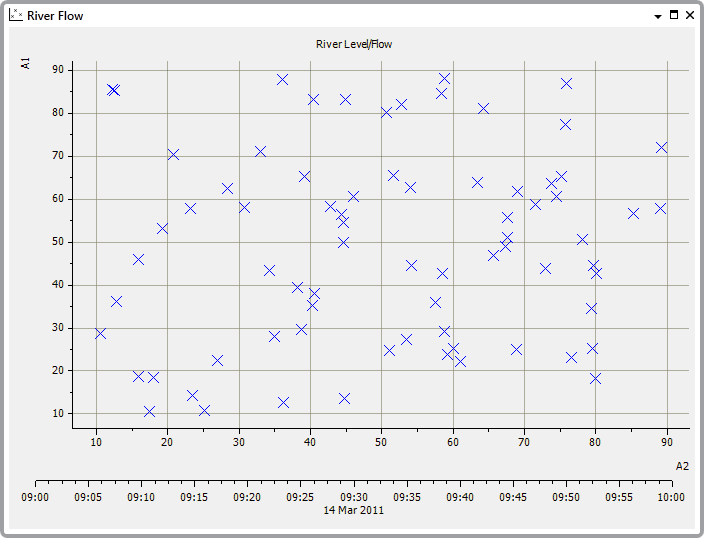
You can display grid lines on the X-Axis or the Y-Axis of an X-Y Plot. The grid lines are a visual indicator that can make it easier to determine the values—you can use the grid lines to line up the values and times on the X-Y Plot.
The grid feature is especially useful when you are trying to determine the value of markers that are not positioned near to an axis.
To show the grid lines:
- Display an X-Y Plot in Run Mode.
NOTE: The Show Grid option is also available when you are configuring the X-Y Plot in Design mode.
- Right-click on the Y-Axis or X-Axis as required.
A context sensitive menu is displayed. - Select the Show Grid option.
The horizontal or vertical grid lines are displayed (the horizontal lines are for the Y-Axis, and the vertical lines are for the X-Axis).
To hide the grid lines:
- Display an X-Y Plot in Run Mode.
NOTE: The Show Grid option is also available when you are configuring the X-Y Plot in Design mode.
- Right-click on the Y-Axis or X-Axis as required.
A context sensitive menu is displayed. - De-select the Show Grid option.
The horizontal or vertical grid lines are hidden (the horizontal lines are for the Y-Axis, and the vertical lines are for the X-Axis).