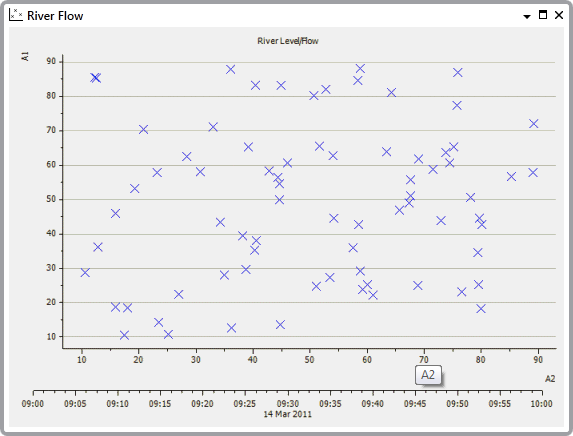
You can use the Size to Data option to set ViewX to alter the magnification level of an X-Y Plot automatically. The X-Y Plot will then reduce the level of magnification so that the first value, last value, and all values in between can be seen at once.
To size an X-Y Plot automatically:
- Display an X-Y Plot in Run Mode.
NOTE: The Size to Data option is also available when you are configuring the X-Y Plot in Design mode.
- Right-click above the X-Axis and to the right of the Y-Axis to display a context sensitive menu.
- Select the Size to Data option.
The X-Y Plot alters its magnification level automatically so that you view the entire range of plotted values on the X-Y Plot