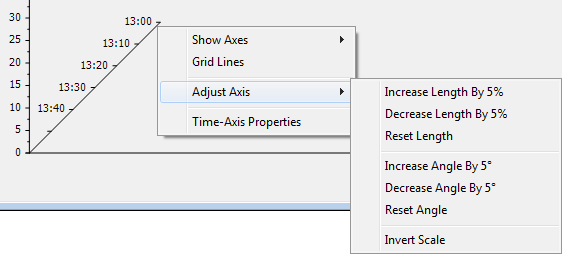
You configure properties, such as the angle of the Time axis, as part of the initial X-Y-Z Plot configuration (see Configure the Axis Display Settings). Thereafter, you can make further adjustments to the Time axis, if required, using the Time Axis Properties window. You can also make various adjustments to the Time axis using the axis's context-sensitive menu. To adjust the Time axis using the menu options:
- Display the X-Y-Z Plot in Design mode (see Display an X-Y-Z Plot in Design Mode).
- Right-click on the Time axis.
A context-sensitive menu is displayed. - Select the Adjust Axis option.
A further context-sensitive menu is displayed.
- Select the required option from those offered:
- Increase Length by 5%: Use to increase the length of the Time axis and traces by 5%.
- Decrease Length by 5%: Use to decrease the length of the Time axis and traces by 5%.
- Reset Length: Use to reset the length of the Time axis and traces back to the default (for example, 33% of the Plot height). The default is the Time axis Length that is specified in the Time Axis Properties window that you access via the Options window (see Define the Default Settings for New X-Y-Z Plots). The default is independent of the Lengththat is specified in the Time Axis Properties window that you access via the individual X-Y-Z Plot.
- Increase Angle by 5°: Use to increase the angle of the Time axis and traces by 5° from the x-axis.
- Decrease Angle by 5°: Use to decrease the angle of the Time axis and traces by 5° from the x-axis.
- Reset Angle: Use to reset the angle of the Time axis and traces back to the default (for example, 45°). The default is the Time axis Angle that is specified in the Time Axis Properties window that you access via the Options window (see Define the Default Settings for New X-Y-Z Plots). The default is independent of the Angle that is specified in the Time Axis Properties window that you access via the individual X-Y-Z Plot.
- Invert Scale: Use to invert the scale shown on the Time axis. If the latest time appears at the front of the axis, when inverted it will appear at the back of the axis. The reverse applies to the earliest time shown on the axis.
- Either:
- Select the Save button to store the changes to the X-Y-Z Plot.
ClearSCADA updates the Time axis configuration to take into account the adjustments that have been made to the axis. - Close the X-Y-Z Plot without saving the changes if the adjustments that you have made to the Time axis are only required temporarily.
ClearSCADA discards the changes made using the menu options when the X-Y-Z Plot is closed.
- Select the Save button to store the changes to the X-Y-Z Plot.