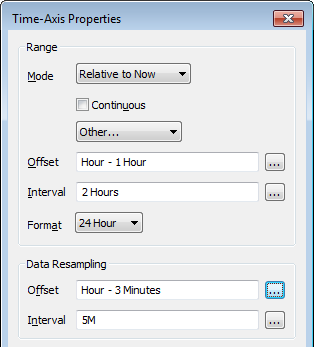
The data that is shown on an X-Y-Z Plot trace comprises processed historic data—values that result from a calculation that ClearSCADA has performed on the source's raw historic data. You can specify the amount of data that ClearSCADA includes in each sample of raw historic values that it uses in its calculations. You do this using fields in the Time Axis Properties window (see Configure the Time-Axis Properties).
Use the Data Resampling section of the window to configure these properties:

- Offset: Use to specify the starting time base from which ClearSCADA performs its calculations on the raw historic data. For example, if the Offset is set to 'Hour - 5 Minutes', this instructs ClearSCADA to perform its calculations using the raw historic values that the data source has reported since 5 minutes before the start of the first hour shown on the Time axis.
Enter the required offset in the OPC Relative Time Format. You can enter the value directly in the field, or use the Offset window (accessed via the field's browse button) to specify the required value.
- Interval: Use to specify the time period over which ClearSCADA samples the raw historic data. For example, if the Interval is set to 10M, this instructs ClearSCADA to perform its calculations using ten minutes' worth of raw historic values. The Interval also defines how often ClearSCADA calculates the processed historic values. ClearSCADA uses the Offset and Interval in conjunction with the earliest time shown on the Time axis to determine the occurrence time of the earliest processed value (as shown in the example below).
Enter the required interval in the OPC Time Format. You can enter the value directly in the field, or use the Interval window (accessed via the field's browse button) to specify the required value.
NOTE: Combinations of sample time and offset time can result in interpolated points changing their plotted values as the time axis is scrolled. If the Offset time is less than or not a multiple of the Interval time this can result in interpolated points changing their plotted values as the time axis is scrolled. This can be avoided by ensuring that the Offset time is the same as the Interval time or greater in multiples of the Interval time.You should select an interval time that has a relationship to the sampling time of the original data.
Example:
The Time axis for an X-Y-Z Plot includes the following configuration:

The Range settings specify that the X-Y-Z Plot is to include processed historic data values for a two-hour period, starting from the beginning of the last hour.
The Data Resampling settings instruct ClearSCADA to calculate the data values at five-minute intervals, with sampling starting from 3 minutes before the start of the first hour that is shown on the X-Y-Z Plot.
At 14:28, the X-Y-Z Plot's Time axis shows that the Plot includes data for the time period 13:00 to 15:00 (the two-hour period that starts from the beginning of the previous hour).
The processed historic values shown on the X-Y-Z Plot have occurrence times of 13:02, 13:07, 13:12, and so on (as defined by the Data Resampling settings).
You can specify the quality of the raw historic data that ClearSCADA includes in its calculations. You specify this on a per data source basis (see Specify the Quality of the Values that are to be Shown on the Trace).
Further Information
Specify the Algorithm that is used to Process the Source's Historic Data.