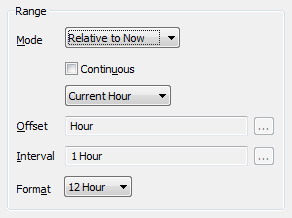
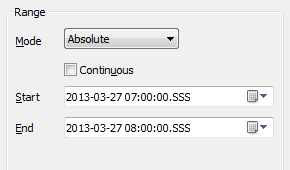
You can specify the time period that is shown on the X-Y-Z Plot. This defines the time period for which the X-Y-Z Plot displays trace values. You specify the time period using fields in the Time Axis Properties window (see Configure the Time-Axis Properties).
Use the Range section of the window to specify these properties:

- Mode—Use to define the type of time scale shown on the Time axis. Choose from:
- Absolute: The axis displays a specific time period. You define the required time period using the Start and End fields (see below).
- Relative to Now: The axis displays a time period that is relative to the present time. For example, the time period for the previous hour.
- Relative to Latest: The axis displays a time period that is relative to the latest data value that is included on the X-Y-Z Plot.
- Continuous—Select this check box to specify that ClearSCADA should update the time range that it shows on the Time axis, to reflect the current time.
Clear this check box to specify that ClearSCADA should not update the time period on the Time axis to reflect the current time.
Example:
The Continuous check box is selected (enabled).
The Offset is Hour (H) and the Interval is 1 Hour (1H), so the Time axis displays the values for a one hour period from the start of the current hour.
The current time is 10.30, so the Time axis shows the time range from 10:00 to 11:00.
When the time reaches 11:00, ClearSCADA updates the Time axis so that it shows the time range from 11:00 to 12:00.
If the Continuous check box had been clear, ClearSCADA would not have updated the Time axis to show the time range from 11:00 to 12:00—the axis would still have shown the time range from 10:00 to 11:00.
When the Mode is set to a Relative option, ClearSCADA displays a combo box below the Continuous check box. Use the combo box to specify the duration of the time period ClearSCADA will show on the Time axis. Choose from:
- Current Minute—Sets the axis to represent 1 minute, beginning at the start of the current minute. (The Offset and Interval are configured automatically and are grayed out).
- Previous Minute—Sets the axis to represent 1 minute, beginning at the start of the previous minute. (The Offset and Interval are configured automatically and are grayed out).
- Current Hour—Sets the axis to represent 1 hour, beginning at the start of the current hour. (The Offset and Interval are configured automatically and are grayed out).
- Previous Hour—Sets the axis to represent 1 hour, beginning at the start of the previous hour (The Offset and Interval are configured automatically and are grayed out).
- Today—Sets the axis to represent 1 day, beginning at the start of the current day. (The Offset and Interval are configured automatically and are grayed out).
- Yesterday—Sets the axis to represent 1 day, beginning at the start of the previous day. (The Offset and Interval are configured automatically and are grayed out).
- This Week—Sets the axis to represent 1 week, beginning at the start of the current week. (The Offset and Interval are configured automatically and are grayed out).
- Last Week—Sets the axis to represent 1 week, beginning at the start of the previous week. (The Offset and Interval are configured automatically and are grayed out).
- This Month—Sets the axis to represent 1 month, beginning at the start of the current month. (The Offset and Interval are configured automatically and are grayed out).
- Last Month—Sets the axis to represent 1 month, beginning at the start of the previous month. (The Offset and Interval are configured automatically and are grayed out).
- This Year—Sets the axis to represent 1 year, beginning at the start of the current year. (The Offset and Interval are configured automatically and are grayed out).
- Last Year—Sets the axis to represent 1 year, beginning at the start of the previous year. (The Offset and Interval are configured automatically and are grayed out).
- Other—Allows you to define the time span shown on the axis. When you select the Other option, the Offset and Interval fields become available. Use the Offset and Interval fields to define the time scale shown on the axis.
- Offset—This field is only available for use if the second combo box mentioned above is set to 'Other'. Use the field to specify the start time of the time period shown on the axis. For example, set the Offset to 'Day' for the start time to be the beginning of the present day. Enter the required offset in the OPC Relative Time Format. You can enter the value directly in the field, or use the Offset window (accessed via the field's browse button) to specify the required value.
- Interval—This field is only available for use if the second combo box mentioned above is set to 'Other'. Use the field to specify the amount of time shown on the axis. For example, set the Interval to '12 Hours' for the axis to show a 12-hour time period. Enter the required interval in the OPC Time Format. You can enter the value directly in the field, or use the Interval window (accessed via the field's browse button) to specify the required value.
- Format: Use this combo box to specify whether time values are displayed in 24 Hour or 12 Hour format on the axis.
For an example of how the above fields can be configured and used in conjunction with the Data Sampling fields, see Configure the Historic Data Resampling Settings.
These fields are displayed in place of the Offset and Interval fields when the Mode is set to 'Absolute':

- Start—Use to specify the earliest date and time that is to be included on the Time axis. For information on specifying a different date or time to that shown, see Specifying the Required Entry in a Date and Time Field in the ClearSCADA Guide to Core Configuration.
- End—Use to specify the latest date and time that is to be included on the Time axis.
Further Information
Specify the format of the axis's time values: see Configure the Axis Display Settings.