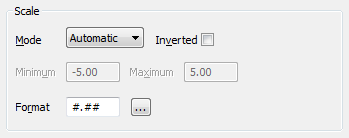
You can specify the scale used on the y-axis. You do this using fields in the Y-Axis Properties window (see Configure the Y-Axis Properties).
Use the Scale section of the window to define these properties:

- Mode: Use to define the method of scaling used on the y-axis. Choose from:
- Manual: You define the lowest and highest values that are shown on the y-axis (and therefore on the traces). You define the values using the Minimum and Maximum fields (see below).
- Range: Scale the y-axis according to the minimum and maximum values of the data sources that are included on the X-Y-Z Plot. For example, a y-axis range of 10 to 90 if the data sources are assigned an overall minimum value of 10 and maximum value of 90. (The y-axis range remains fixed at a scale that takes into account the data sources' minimum and maximum values, regardless of the actual historic values that ClearSCADA processed for those data sources during the time period that is shown on the X-Y-Z Plot. So, for example, the y-axis will remain at 10 to 90 even if the traces' values only oscillate between, say, 30 and 70, during the time period that is shown on the X-Y-Z Plot.)
- Automatic: ClearSCADA scales the y-axis automatically, so that the X-Y-Z Plot can display the data sources' lowest and highest values (within suitable limits) for the time period that is currently shown on the X-Y-Z Plot. The y-axis scale updates to take into account the lowest and highest trace values that apply as the Time axis updates. So, for example, if for the time period being shown, the data sources' values range between 30 and 70, the y-axis scale will take that value range into account. If the X-Y-Z Plot updates to show a time period during which the data sources' values range between 20 and 80, the y-axis scale will update automatically to take into account the increase in value range.
- Inverted: Use this check box to define whether the maximum values are shown at the top or the bottom of the y-axis.
Select the check box to show the maximum value at the bottom of the axis; clear the check box to show the maximum value at the top of the axis.
- Minimum: Use to define the lowest value on the y-axis. This field is only available when the Mode is set to Manual.
- Maximum: Use to define the highest value on the y-axis. This field is only available when the Mode is set to Manual.
- Format: Use to define the format in which values appear on the axis. Use the browse button to display the Text Format window and define the required format. For more information, see Choose a Format Category in the ClearSCADA Guide to Core Configuration.
Further Information
Specify the format of the values that are shown on the y-axis: see Configure the Y-Axis Color and Position.
Use menu options to Invert the Y-Axis Scale.