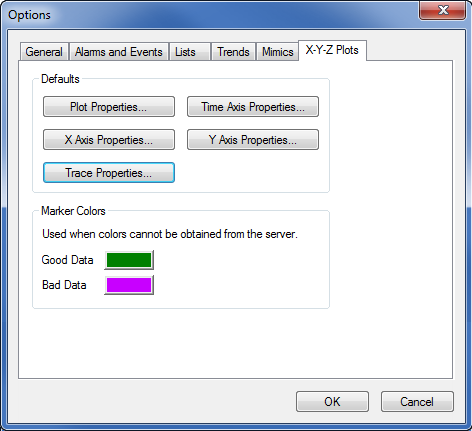
You can use the Options window to define the default settings for new X-Y-Z Plots. ClearSCADA applies these settings to new X-Y-Z Plots automatically. By defining the default settings for X-Y-Z Plots, you may be able to reduce the amount of configuration required (depending whether your X-Y-Z Plots have similar settings).
To configure the default settings for new X-Y-Z Plots:
- Log on to ViewX via a User Account that has the Configure Options feature enabled.
- Display the Options window (see Display the Options Window in the ClearSCADA Guide to Client Administration).
- Select the X-Y-Z Plots tab. This tab contains the settings that ClearSCADA applies to new X-Y-Z Plots by default.

- Use the Plot Properties button to display the X-Y-Z Plot Properties window. Use the window to configure settings such as the font used for the plot's title. The settings work in a similar way to the settings that are available when you edit an X-Y-Z Plot (see Change the Appearance of an X-Y-Z Plot). The difference is that ClearSCADA applies these settings to new X-Y-Z Plots automatically (as such, some properties may be unavailable for use when you access the X-Y-Z Plot Properties window from the Options window).
- Use the Time Axis Properties button to display the Time Axis Properties window. Use the window to configure settings such as the angle and length of the X-Y-Z Plot's Time axis. The settings work in a similar way to the settings that are available when you edit an X-Y-Z Plot (see Configure the Time-Axis Properties). The difference is that ClearSCADA applies these settings to new X-Y-Z Plots automatically (as such, some properties may be unavailable for use when you access the Time Axis Properties window from the Options window).
- Use the X Axis Properties button to display the X-Axis Properties window. Use the window to configure settings such as the font used for the x-axis's label. The settings work in a similar way to the settings that are available when you edit an X-Y-Z Plot (see Configure the X-Axis Properties). The difference is that ClearSCADA applies these settings to new X-Y-Z Plots automatically (as such, some properties may be unavailable for use when you access the X-Axis Properties window from the Options window).
- Use the Y Axis Properties button to display the Y-Axis Properties window. Use the window to configure settings such as the scale used for the y-axis. The settings work in a similar way to the settings that are available when you edit an X-Y-Z Plot (see Configure the Y-Axis Properties). The difference is that ClearSCADA applies these settings to new X-Y-Z Plots automatically (as such, some properties may be unavailable for use when you access the Y-Axis Properties window from the Options window).
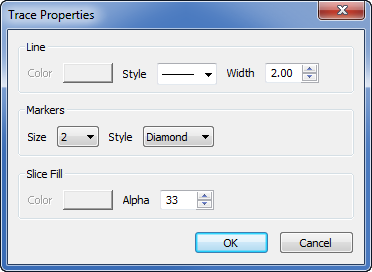
- Use the Trace Properties button to display the Trace Properties window. Use the window to configure settings such as the width and style of trace lines. The settings work in a similar way to the settings that are available when you edit an X-Y-Z Plot (see Configure a Trace). The main difference is that the window only contains those properties that ClearSCADA applies to traces on new X-Y-Z Plots automatically.

- Use the Marker Colors section to define the default colors for the trace marker colors. ClearSCADA applies the colors to markers whenever it cannot obtain the marker colors from the server. Typically, this is when the data sources for the traces on an X-Y-Z Plot are from a non-ClearSCADA database, for example, another OPC database.
You can define the following marker colors (they are only used if color settings cannot be retrieved from a ClearSCADA server):
- Good Data: The color of the markers that indicate good quality values (values that are reliably accurate).
- Bad Data: The color of the markers that indicate bad quality values (values that are unreliable and may be inaccurate).
For data sources that are in the ClearSCADA database, ClearSCADA uses the appropriate color from Color Palette (see System Colors in the ClearSCADA Guide to Core Configuration). Again, the marker color varies, depending on the quality of the data, as described above. The applicable colors are prefixed with the word 'Trend' in the Color Palette, for example, Trend - Validated/Good Data. If ClearSCADA is unable to obtain the marker color from the server (for example, if communications with the server is interrupted when an X-Y-Z Plot is redrawn), ClearSCADA will apply the marker colors that are defined in the Options window (described above).
Further Information