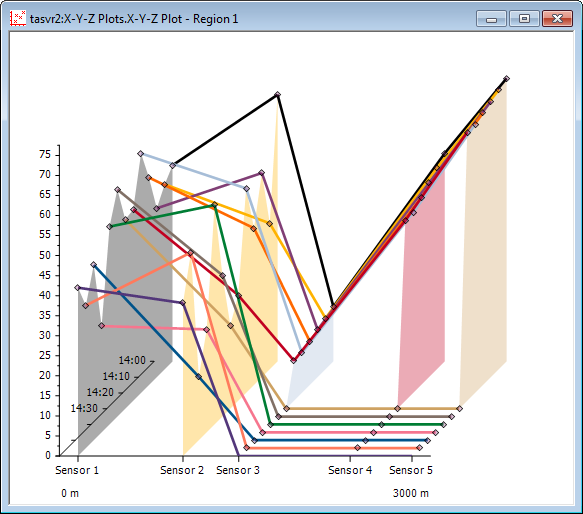
Operator-level users (users that operate the system, rather than configure it) need to use X-Y-Z Plots in Run mode. When an X-Y-Z Plot is displayed in Run mode, users can access navigation features and use them to view and compare data on the Plot.
On a ViewX client, security permissions and menu options determine whether you display X-Y-Z Plots in Run mode or Design mode.
On a WebX client, you can only display X-Y-Z Plots in Run mode.
To display an X-Y-Z Plot in Run mode:
- Log on to ViewX via a User Account that has the Operate feature enabled (on the User Form) and has the Read and Browse permissions for the X-Y-Z Plot (or its parent Group).
- Display the Database Bar (see Display an Explorer Bar in the ClearSCADA Guide to ViewX and WebX Clients).
- In the Database Bar, locate the X-Y-Z Plot that you want to display in Run mode.
- Right-click on the X-Y-Z Plot in the Database Bar.
A context-sensitive menu is displayed. - Select the Display X-Y-Z Plot pick action.
The X-Y-Z Plot is displayed in Run mode.
Alternatively, you can display an X-Y-Z Plot in Run mode by performing one of the following:
- Double-click on the X-Y-Z Plot in the Database Bar (if your User Account does not have the Double Click Edits Documents feature enabled).
Or:
- Display the X-Y-Z Plot on, or from, a suitably configured Mimic.
Or:
- Right-click on the X-Y-Z Plot in a Queries List.
- Select the Display option.
Or:
- If your User Account provides access to Favorites, you can display an X-Y-Z Plot that you have previously added to your Favorites list. For more information, see Use the Favorites Bar to Access your Favorites in the ClearSCADA Guide to ViewX and WebX Clients.
Or:
- Display the X-Y-Z Plot in Design mode (see Display an X-Y-Z Plot in Design Mode).
- Perform one of the following:
- Deselect the Design Mode button
 on the Quick Access Toolbar.
Or:
- Deselect the Design Mode command
 on the ViewX ribbon's Edit tab.
- Deselect the Design Mode button
On a WebX client, you display and operate X-Y-Z Plots in a similar way to pre-configured Trends (see View and Action Trends on a WebX Client in the ClearSCADA Guide to ViewX and WebX Clients).
Further Information
Display an X-Y-Z Plot's context-sensitive object menu: see Display the Object Menu in the ClearSCADA Guide to ViewX and WebX Clients.