You can display grid lines for any of the axes on an X-Y-Z Plot. Grid lines are a visual indicator that can make it easier to determine the values that are shown on the Plot—you can use the grid lines to line up the values on the traces with the times or other ranges shown on the axes.
NOTE: The visibility of grid lines when an engineer saves a plot's configuration in Design mode determines whether grid lines are shown on an X-Y-Z Plot by default.
To show or hide the grid lines:
- Right-click on the relevant axis.
A context-sensitive menu is displayed. - Select the Grid Lines option.
Grid lines are displayed for the selected axis (or hidden if they were already on display). - Repeat the above steps to show or hide grid lines for the other axes as required (you can display grid lines for none, one, or multiple axes).
Example:
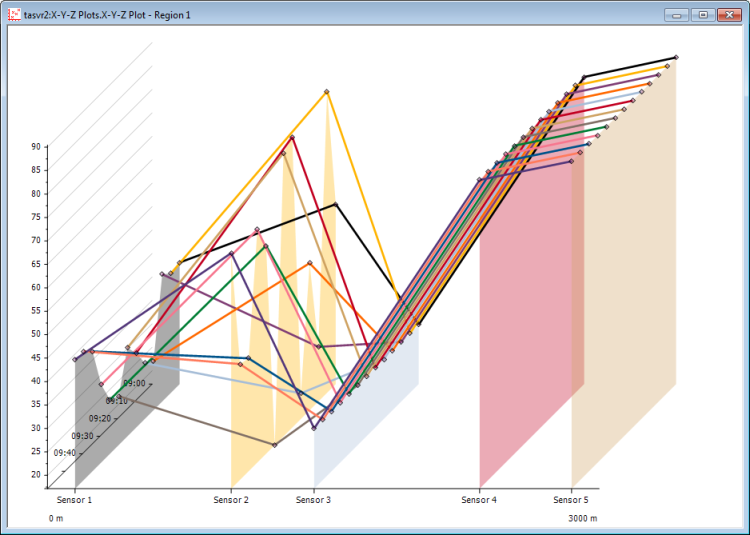
An X-Y-Z Plot with y-axis grid lines on show:

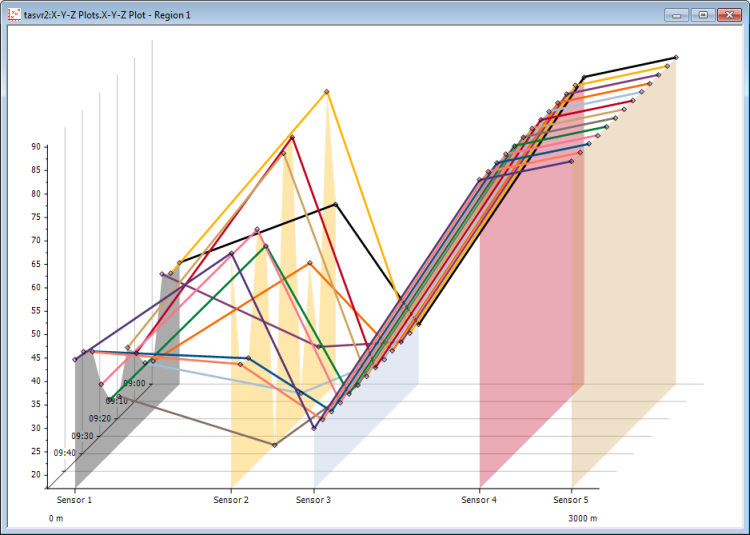
The same X-Y-Z Plot with Time axis grid lines on show:

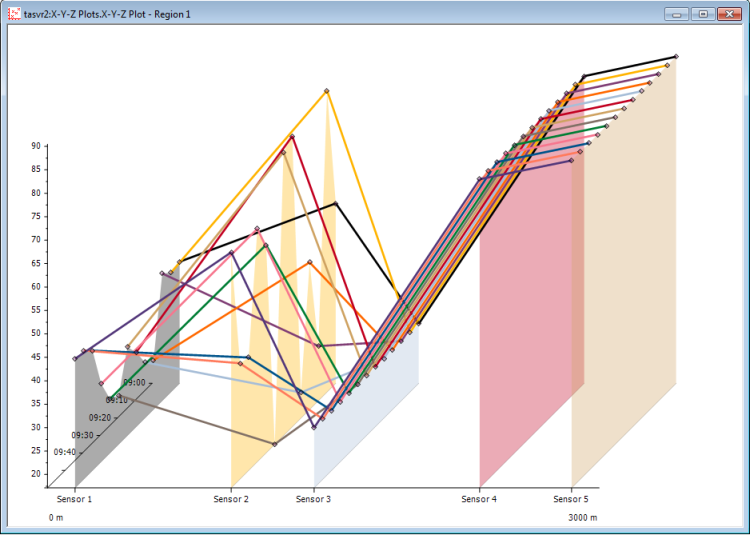
The same X-Y-Z Plot with x-axis grid lines on show (one grid line per trace):
