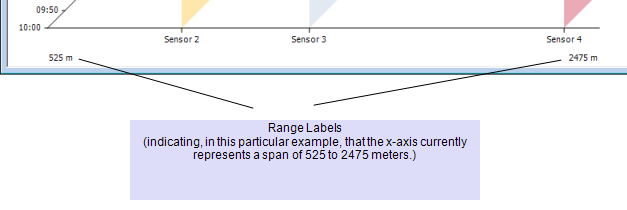
You can show or hide the labels that indicate the range that the x-axis represents. The labels are especially useful when zooming or panning along the x-axis, as they indicate the span that the axis currently shows.
NOTE: Regardless of whether Range Labels are on show, you can still view range information in a ToolTip (see View Information about a Particular Position on the X-Axis).
To show or hide the Range Labels:
- Right-click on the x-axis.
A context-sensitive menu is displayed. - Select the Range Labels option.
The Range Labels are displayed (or hidden if they were already on display). The values and units shown vary, depending on the labels' configuration, the current zoom level, and so on.
Example:
An X-Y-Z Plot with Range Labels shown:
