UNEXPECTED BEHAVIOR OF APPLICATION
You can show or hide a trace's markers. Hiding markers is useful if you only want to view the markers on a particular trace—you can hide the markers on other traces that overlap the trace in which you are interested.
To show or hide a trace's markers:
- Right-click on the tick (short line) that indicates the trace's position on the x-axis.
A context-sensitive menu is displayed - Select the Show option.
A further context-sensitive menu is displayed. - Enable or disable the Markers option as required.
The trace's markers are shown or hidden depending whether you enabled or disabled the option.
NOTE: There is also a Show>All option that you can use to show the trace, trace label, trace markers, and slice fill color associated with an individual trace. The Show>None option enables you to hide the trace, trace label, trace markers, and slice fill color associated with an individual trace (see Show or Hide the Whole Trace Entry).
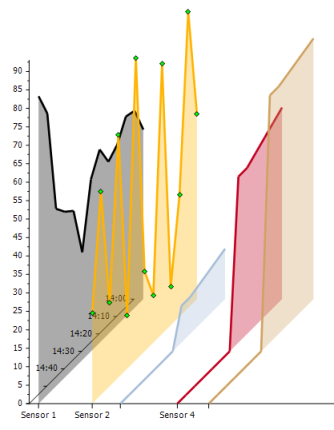
Example:
An X-Y-Z Plot with markers and trace labels shown for each data source:
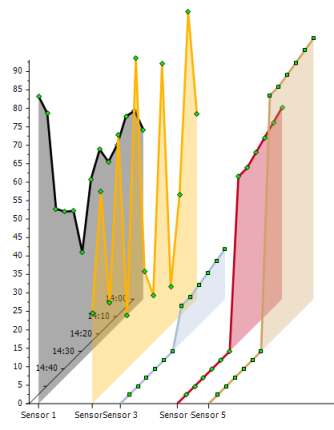
The same X-Y-Z Plot with markers hidden for the data sources other than 'Sensor 2'. (Additionally, the trace labels have been hidden for 'Sensor 3' and 'Sensor 5'.)