UNEXPECTED BEHAVIOR OF APPLICATION
You can show of hide the content that is associated with a trace—this includes the trace's label, markers, slice fill color, and (if applicable) the trace line. (A line is only drawn between trace values when an X-Y-Z Plot's Drawing Mode is set to 'Connect by Point' or 'Connect by Point and Timestamp' (see Configure the Background Color and Drawing Mode).)
To hide the content that is associated with a trace:
- Right-click on the tick (short line) that indicates the trace's position on the x-axis.
A context-sensitive menu is displayed - Select the Show option.
A further context-sensitive menu is displayed. - Select the None option.
The content that is associated with the trace is omitted from the X-Y-Z Plot. The x-axis retains the tick that indicates the hidden trace's position. If the X-Y-Z Plot uses one of the 'Connect by Timestamp' Drawing Modes, the lines that link the surrounding data values are redrawn to omit reference to the hidden set of data.
To show the content that is associated with a currently hidden trace:
- Right-click on the tick (short line) that indicates the hidden trace's position on the x-axis.
A context-sensitive menu is displayed - Select the Show option.
A further context-sensitive menu is displayed. - Select the All option.
The content that is associated with the selected trace entry is shown on the X-Y-Z Plot. This includes the trace's label, markers, slice fill color, and (if applicable) the trace line. If the X-Y-Z Plot uses one of the 'Connect by Timestamp' Drawing Modes, the lines that link the surrounding data values are redrawn to take into account the redisplayed set of data.
As an alternative to selecting the 'All' option, you can opt to redisplay just a subset of the trace's content, such as just the markers or trace label (see Show or Hide the Content that is Associated with an Individual Trace). Again, if applicable, ClearSCADA will redraw the lines that link the surrounding data values to take into account the redisplayed subset of data. This applies if you do opt to redisplay a previously hidden trace line, set of markers, or slice fill color and the X-Y-Z Plot uses one of the 'Connect by Timestamp' Drawing Modes.
Example:
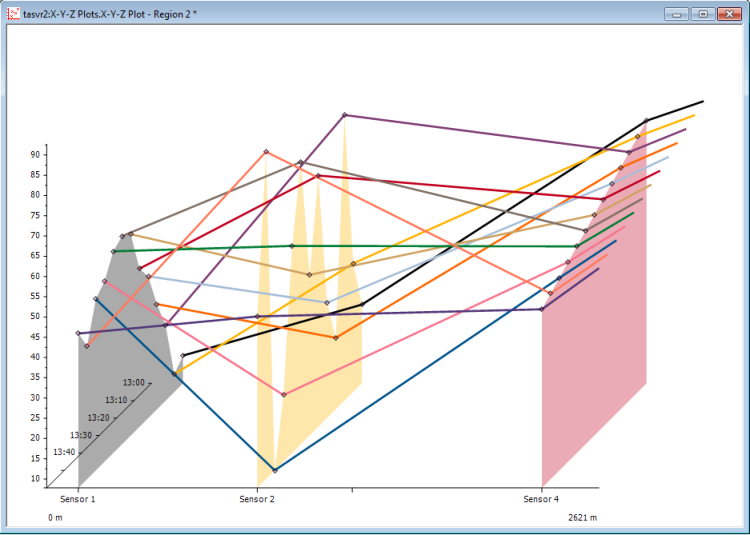
An X-Y-Z Plot showing four sets of data:

The same X-Y-Z Plot after the set of data associated with 'Sensor 3' has been hidden using the 'None' option. ClearSCADA has redrawn the lines that link the surrounding data values so that the lines omit reference to the hidden set of data. (The tick (short line) that indicates the hidden trace's position remains visible on the x-axis, so that the hidden set of data can be redisplayed when required.)

Further Information
If you are working with an X-Y-Z Plot in Design mode, consider whether you want to permanently Remove a Trace that is no longer required.