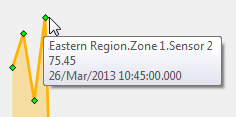
Information about a trace's data values is available in the form ToolTips—one ToolTip per data value.
To display the ToolTip for a particular data value, place the cursor over the relevant trace marker. (If the trace's markers are hidden, either redisplay them or move the cursor along the trace until it is over a data value—a ToolTip appears when the cursor moves over a data value.)
Each ToolTip provides the following information:
Either:
- The full name of the database item that is the trace's data source
Or:
- The label that is assigned to the trace (if the Label differs from the trace's Source).
And
- The data value
- The data and time at which ClearSCADA processed the value.
(The Date Format that is specified on your User Account determines the format in which ClearSCADA displays the date and time.)
Example:
The ToolTip shown below is for a data marker that has a value of 75.45. ClearSCADA processed the value at the date and time shown on the ToolTip. The data value's source is 'Sensor 2'. The database item that represents the sensor is stored in the database in the Group 'Zone 1' (which is itself located in the Group 'Eastern Region').
