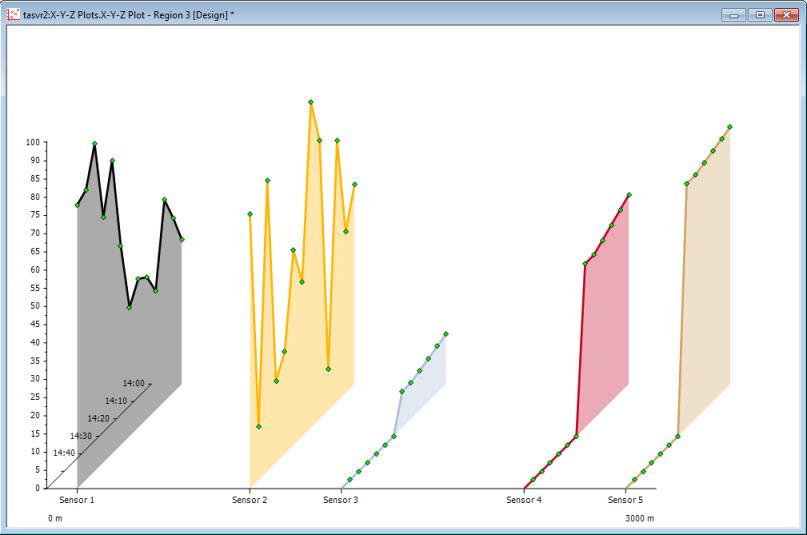
Welcome to the ClearSCADA Guide to X-Y-Z Plots. In this guide, we explain how to configure and use X-Y-Z Plots. X-Y-Z Plots are special types of Trends that you can use to compare the relationship between multiple sets of historic values.

This guide provides an introduction to X-Y-Z Plots (see Understand X-Y-Z Plots).
It also includes sections on:
NOTE: You can display X-Y-Z Plots on ViewX or WebX clients. However, as with other database items, you can only configure X-Y-Z Plots on a ViewX client.